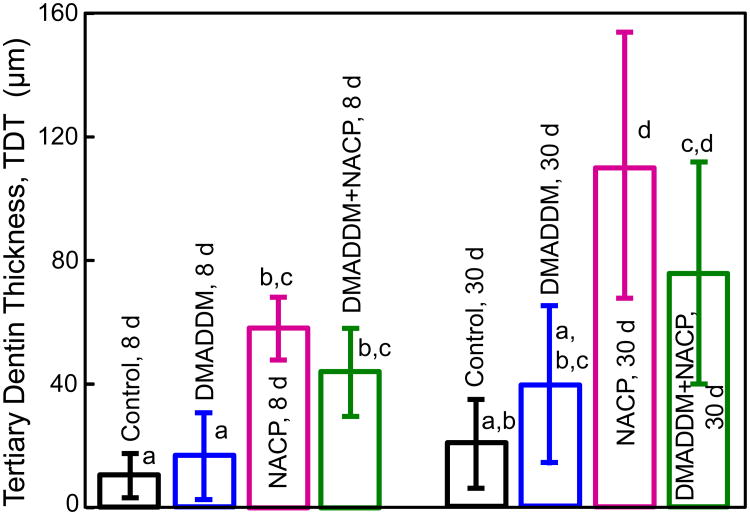
Figure 6.
Tertiary dentin thickness (TDT) measured from H&E histological images (mean ± sd; n = 6). Values with different letters are significantly different from each other (p < 0.05). At each time period, there was no significant difference between Control and DMADDM (p > 0.1). There was no difference between NACP and DMADDM+NACP (p > 0.1). NACP and DMADDM+NACP had TDT that were 5-6 fold that of Control. For each group, TDT at 30 d was about twice that at 8 d.

