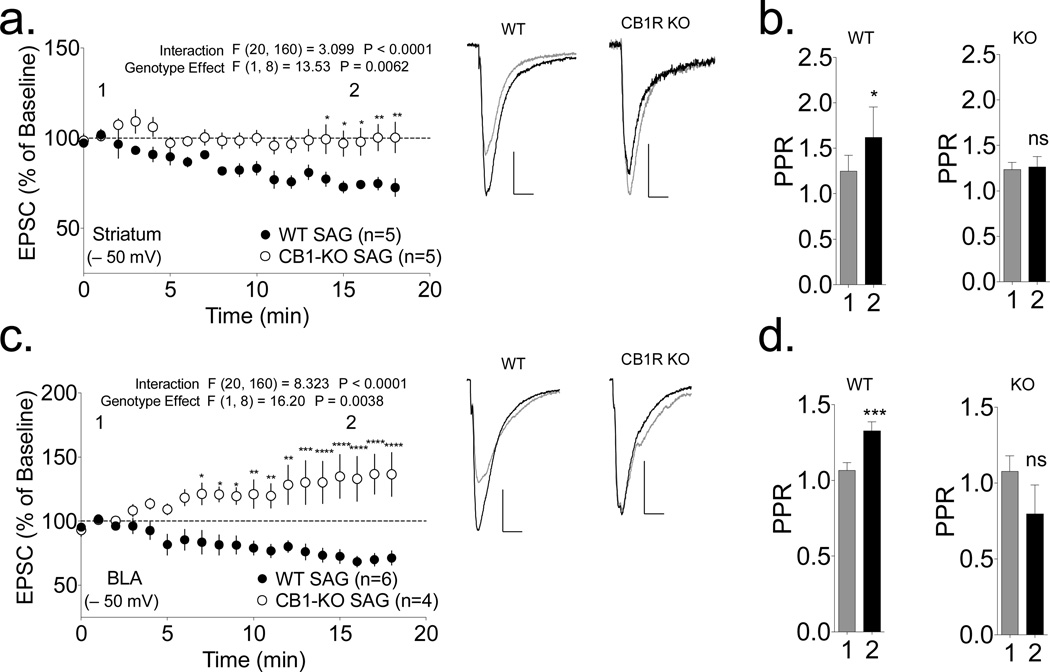
Figure 4. SAG loading initiates CB1R-dependent depression of synaptic transmission in both the striatum and basolateral amygdala.
Intracellular loading of SAG at −50 mV depressed EPSCs in both (a) striatal MSNs (74±3% baseline; p<0.001 by one-sample t-test) and (c) basolateral amygdala (BLA) pyramidal neurons (70±4% baseline; p<0.001 by one-sample t-test) in WT ICR mice, but failed to induce depression in MSNs from CB1R-KO mice (striatum: 100±8% baseline; BLA: 134±17% baseline; p>0.05 by one-sample t-test for both). The 2-way repeated measures ANOVA revealed a significant genotype×treatment interaction and a significant genotype effect as indicated. Sidak’s post hoc testing revealed the indicated significant differences between individual time points; ** p<0.01, ***p<0.001, ***p<0.0001). PPR was significantly increased by loading SAG at −50 mV in both striatal MSNs (b) and BLA neurons (d) of WT ICR mice, but not in neurons from CB1R-KO mice on the same background (* p<0.05, *** p<0.001 by paired t-test). Representative traces for each condition (1: black trace, 2: gray line) are shown to the right (scale bars 100 pA, 10 ms).

