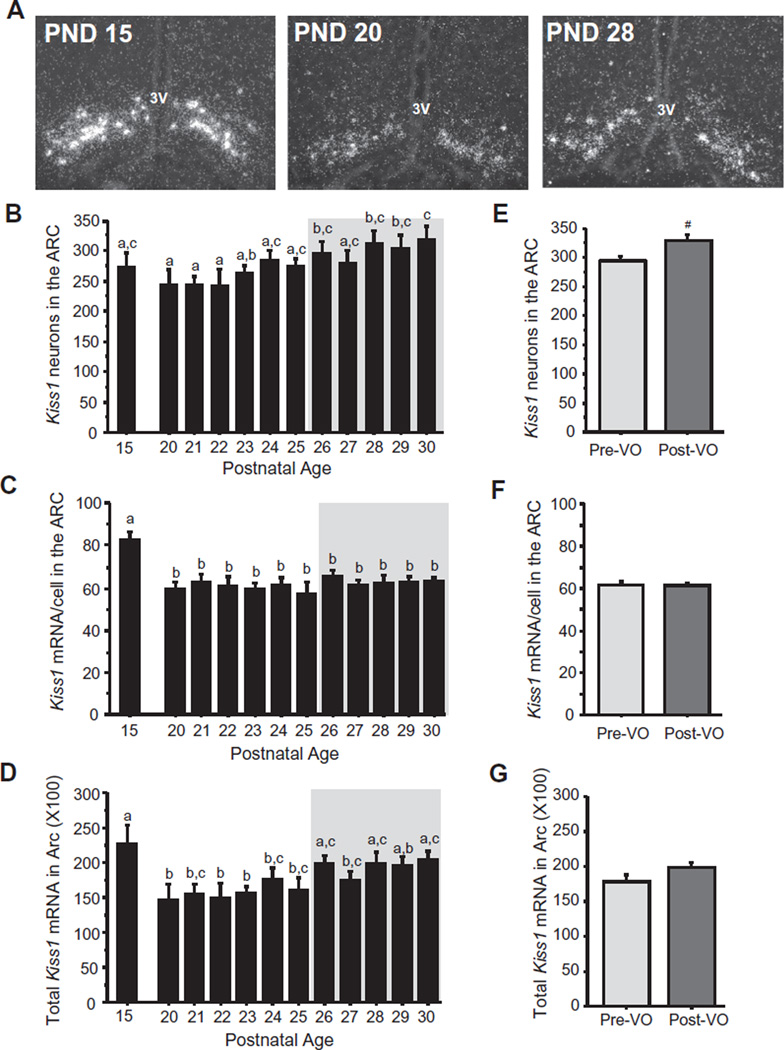
Fig. 3.
Kiss1 expression in the ARC of female prepubertal and pubertal mice. (A) Representative images of Kiss1 expression, determined by ISH, in the ARC of female mice. 3V, third ventricle. (B) Mean numbers of ARC Kiss1 neurons, (C) mean relative Kiss1 mRNA content per neuron in the ARC, and (D) mean relative total Kiss1 mRNA in the ARC of female mice between PND 15 and PND 30, with adult diestrus female (PND 56) shown for comparison. The gray shading denotes the period when VO was observed (PND 26–30). Different letters denote significantly different from each other. (E–G) Kiss1 cell numbers, mRNA per cell, and total mRNA in the ARC in female mice sacrificed just during the VO period (denoted by the gray shaded area in the other graphs) and analyzed based on VO status, independent of age. #, non-significant trend (p = 0.054).

