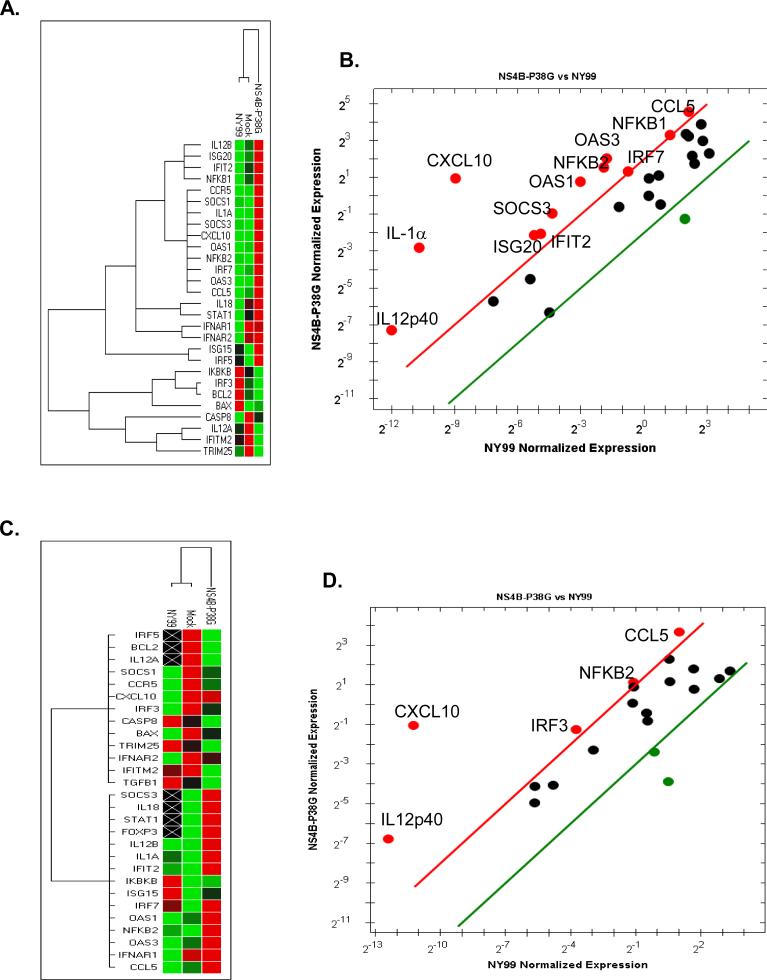
Fig.4.
PCR array following WNV infection. THP-1 cells (A- B) and THP-1 macrophages (C-D) were infected with WNV NY99 and WNV NS4B-P38G mutant at a MOI of 5, harvested at 24h, and analyzed by using a PrimePCR array. A & C. The clustergram image depicts relative expression of a sample as follows: upregulation (higher expression) by a red square, downregulation (lower expression) by a green square, and no regulation by a black square. The lighter the shade of color the greater the relative expression difference. On the outer edges of the data plot is a dendrogram, which indicates the clustering hierarchy. B & D. The scatter plot shows the normalized expression of targets for NY99-infected versus NS4B-P38G infected samples. The plot image shows the following changes in target expression based on the threshold set of 4: upregulation as red circles, downregulation as green circles; and no change as black circles.

