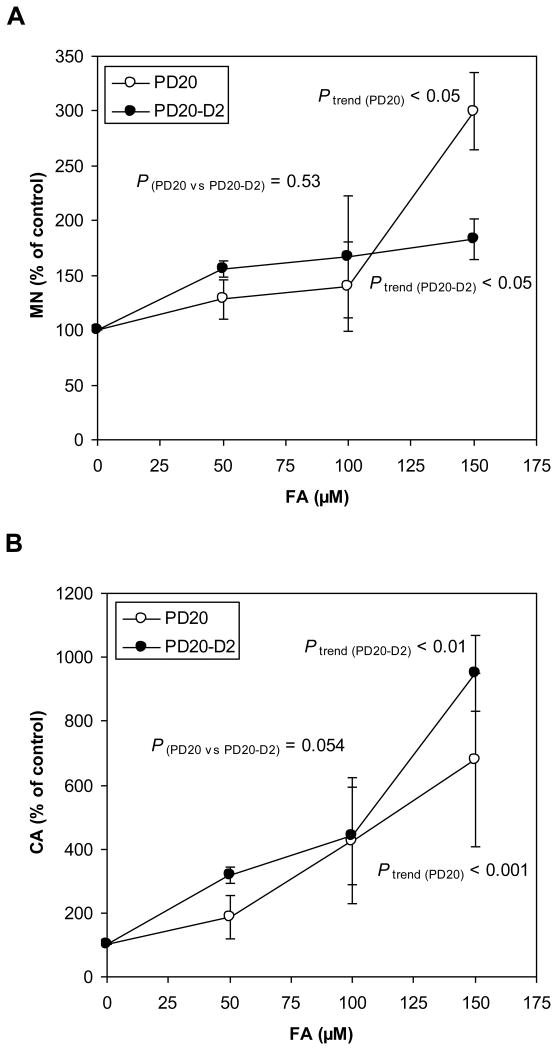
Fig. 4.
Chromosomal damage (MN and CA) induced by FA in PD20 and PD20-D2 cells.
(A) MN levels in FA-treated PD20 and PD20-D2 cells as a percentage of untreated control cells. FA increased MN in a dose-dependent manner in both cell lines (Ptrend (PD20) < 0.05 and Ptrend (PD20-D2) < 0.05), while MN inductions in the two cell lines across FA doses were not significantly different (P (PD20 vs PD20-D2) = 0.53). A higher MN induction was observed in the PD20 cells at 150 μM FA (300%) than in the PD20-D2 cells (183%).
(B) CA levels in FA-treated PD20 and PD20-D2 cells as a percentage of untreated control cells. FA increased CA in a dose-dependent manner in both cell lines (Ptrend (PD20) < 0.001 and Ptrend (PD20-D2) < 0.01), while induction of CA was not statistically different between the two cell lines.

