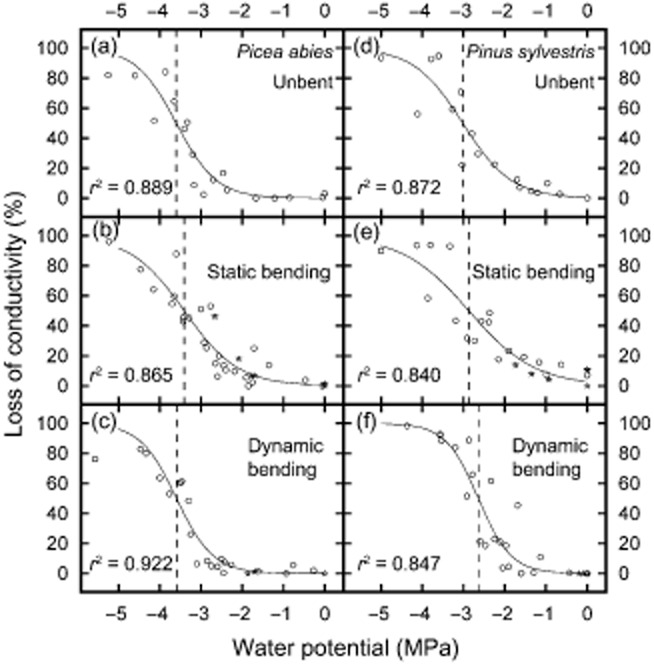
Figure 3.

Vulnerability to drought-induced embolism. Vulnerability curves (PLC versus Ψ) of Picea abies (a–c) and Pinus sylvestris branches (d–f). Branches were either mechanically unstressed (a,d) or exposed to static (b,e) or dynamic bending (c,f) during dehydration. Vertical lines indicate Ψ50. Asterisks indicate controls (see Results).
