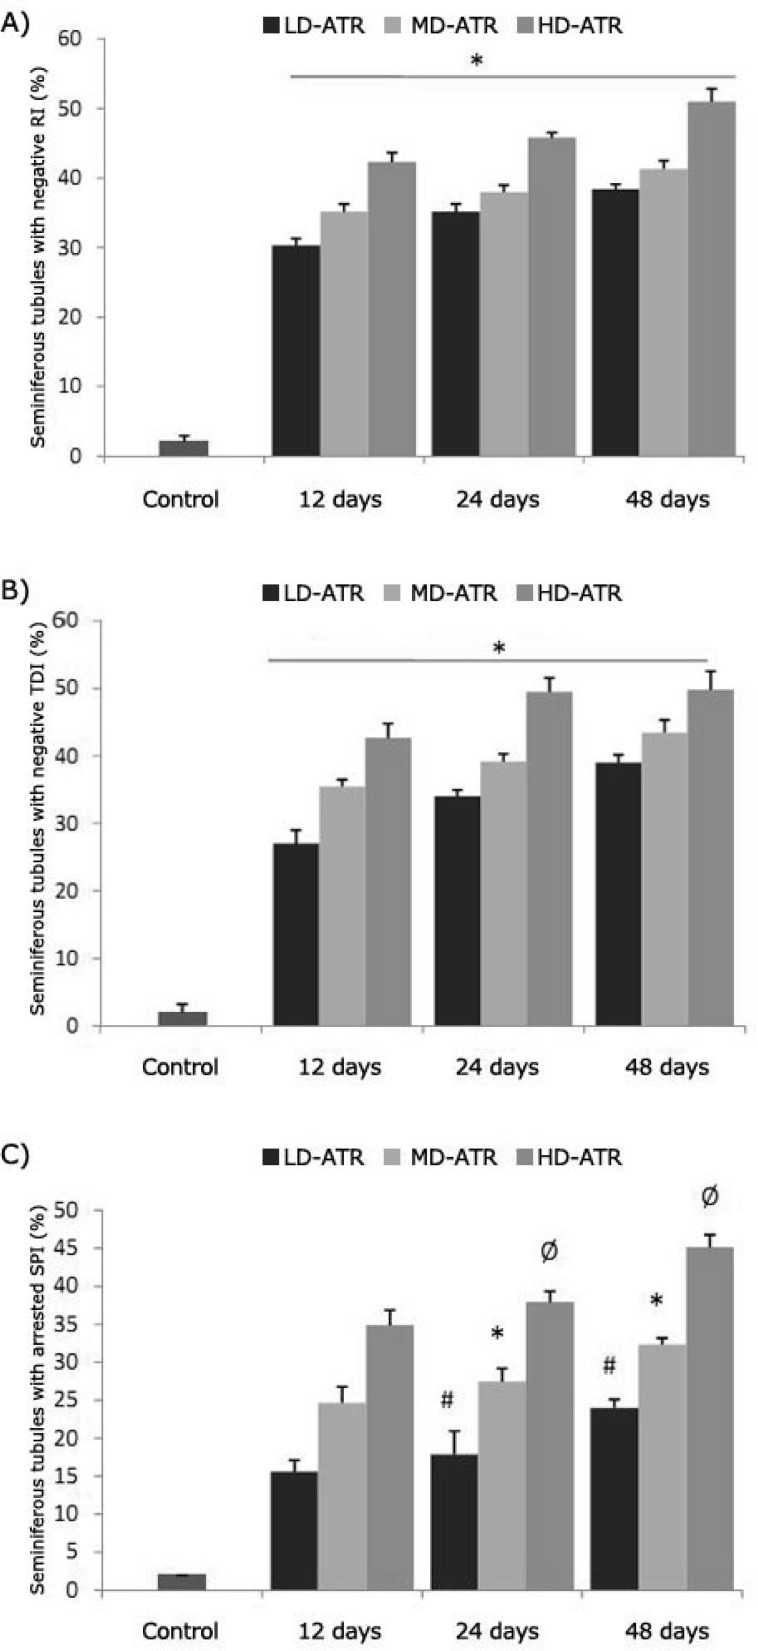
Fig. 2.
Percentage of the seminiferous tubules with negative RI (A), TDI (B) and SPI (C); stars in figures A and B are indicating significant differences between test groups with each other and with control group. In figure C, #, *, Ø are indicating significant differences (P ≤ 0.05) and there are significant differences between all test groups and control group (P ≤ 0.05). All data are presented as mean ± SD.

