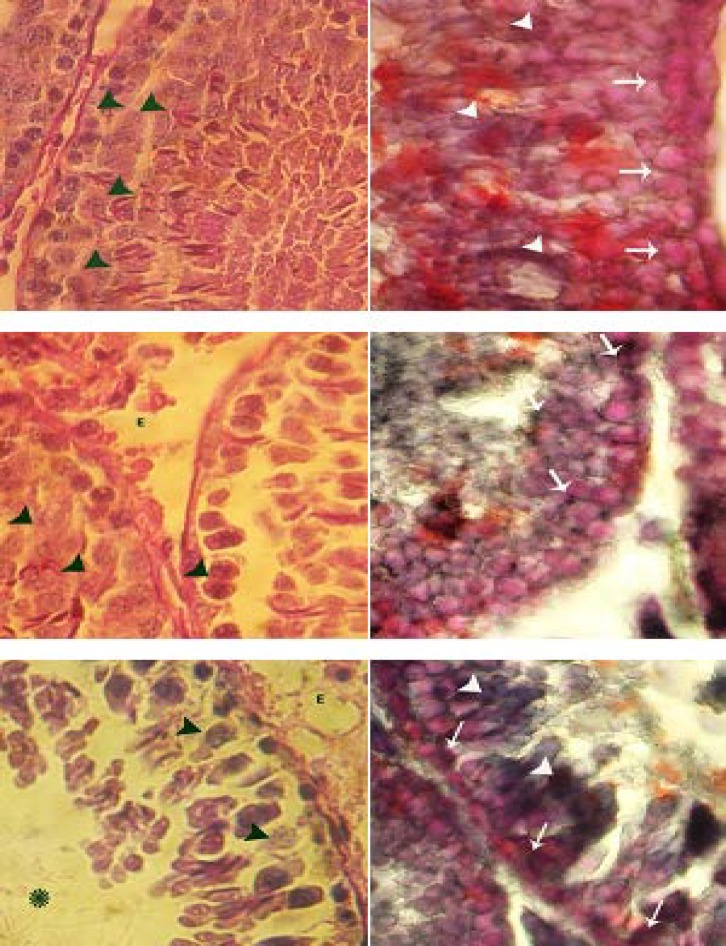
Fig. 3.
Cross sections from testes; histochemical staining for CH (left column) and UFA (right column). Control group (first row); note the PAS positive spermatogonia and spermatocyte type I cells (black head arrows), the SB-B negative cells spermatogonia and spermatocyte type I cells (white arrows) and densely SB-B stained spermatids (white head arrows). LD-ATR-induced group (mid row); note the edema in the interstitial connective tissue (E) and faint PAS stained spermatocyte type I cells (black head arrows) and faint SB-B stained spermatogonia and spermatocyte type I cells (white arrows). High dose ATR-induced group (last row); note the PAS negative spermatocyte type I cells (black head arrows) with severe edema in the connective tissue (E). The spermatogonia and type I spermatocytes are presented with dark SB-B stained cytoplasms (white arrows) and the spermatids are densely SB-B stained (white head arrows). Periodic acid shift (right column) and Sudan Black-B staining (left column), 400×.

