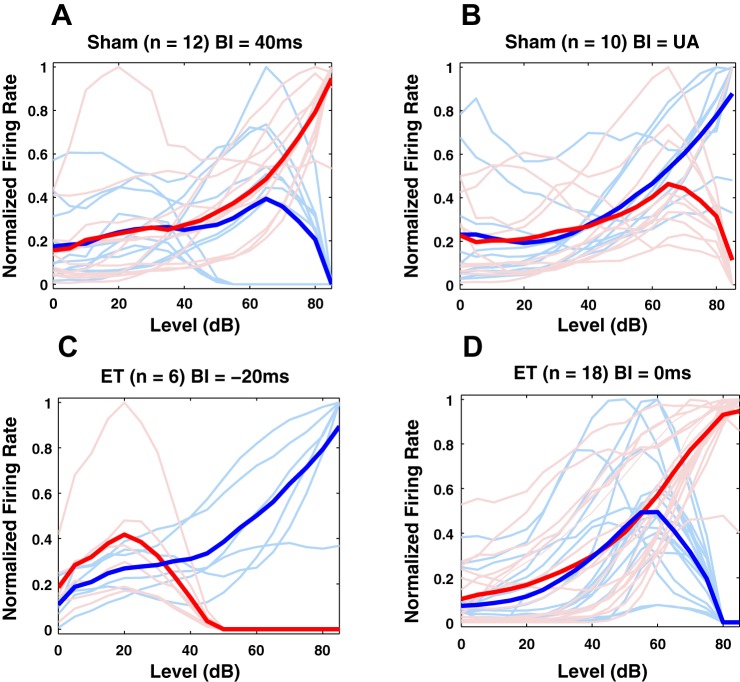
Fig. 10.
Representative examples of qualitative modifications from monotonic to nonmonotonic profiles of RLFs of dorsal cochlear nucleus fusiform cells. A: in sham animals bimodal stimulation with BI = 40 ms induces a consistent change from an initial nonmonotonic RLF profile (blue curve) to a monotonic profile after bimodal stimulation (red curve). B: in contrast, a bimodal stimulation with BI = 10 ms induces opposite modifications where RLFs change from an initial monotonic profile to a nonmonotonic one after stimulation. UA, unimodal acoustic. C: similar pattern is observed in noise-exposed animals with evidence for tinnitus (ET), in this case also accompanied by significant changes in the lower gain of the RLFs. D: similar to A, example of RLFs modifications from a nonmonotonic to a monotonic profile observed in ET animals after bimodal stimulation with BI = 0 ms.

