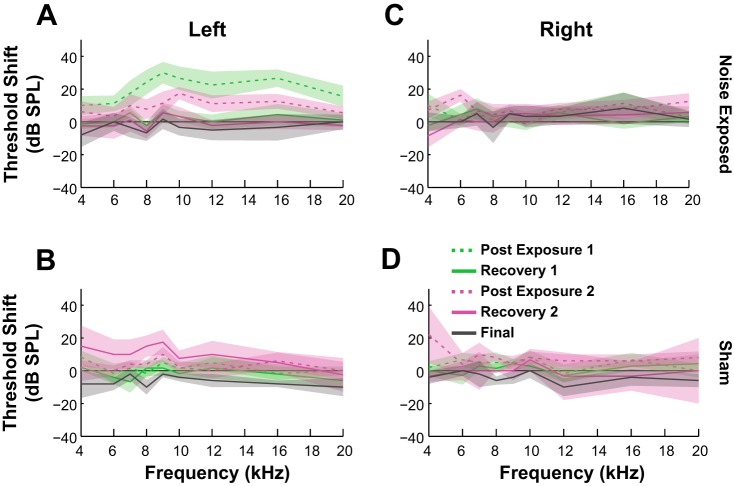
Fig. 2.
Evaluation of ABR threshold shift and spontaneous activity. ABR thresholds were elevated for noise-exposed guinea pigs in the exposed (A) but not the unexposed (B) ear or both ears of the sham-exposed animals (C and D). Thresholds were measured after the first noise exposure (green) and the second exposure (pink) and before the acute eletrophysiological unit recordings (gray solid line). Dashed lines represent thresholds evaluated immediately after noise exposure while solid lines indicate the measurements after recovery 1 (R1, solid green line; R2, solid pink line). Shaded bands indicate 95% confidence intervals.

