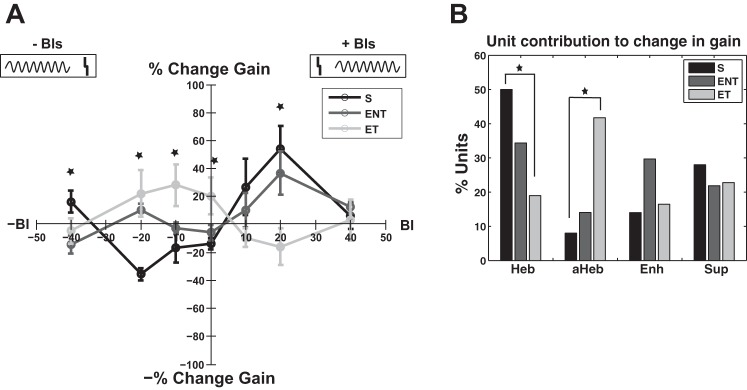
Fig. 8.

Learning rules of the change in gain in sham and noise-exposed animals with and without tinnitus. A: learning rule of the gain represented by the percent change as a function of the BI follows a Hebbian profile in sham animals (black curve) with maximum decrease (light gray curve) for BI = −20 ms and maximum increase at BI = 20 ms. In noise-exposed animals with confirmed tinnitus, the learning rule changes to an anti-Hebbian profile with a maximum enhancement (dark gray curve) at BI = −10 ms and maximum decrease at BI = 20 ms. Noise-exposed animals with no evidence for tinnitus exhibit a Hebbian-like learning rule with maximum enhancement in firing rate observed for a BI of +20 ms. Error bars indicate SE. Statistical significance is indicated with stars for each appropriate BI. Diagram at top indicates the relative order of auditory and Sp5 stimulation. The gray vertical lines represents the Sp5 stimulation, and the sinusoid gray curves represent the tone presentation. B: this change after noise damage is reflected in a significant change in the number of individual units that show Hebbian and anti-Hebbian learning rules in sham ENT and ET animals, respectively.
