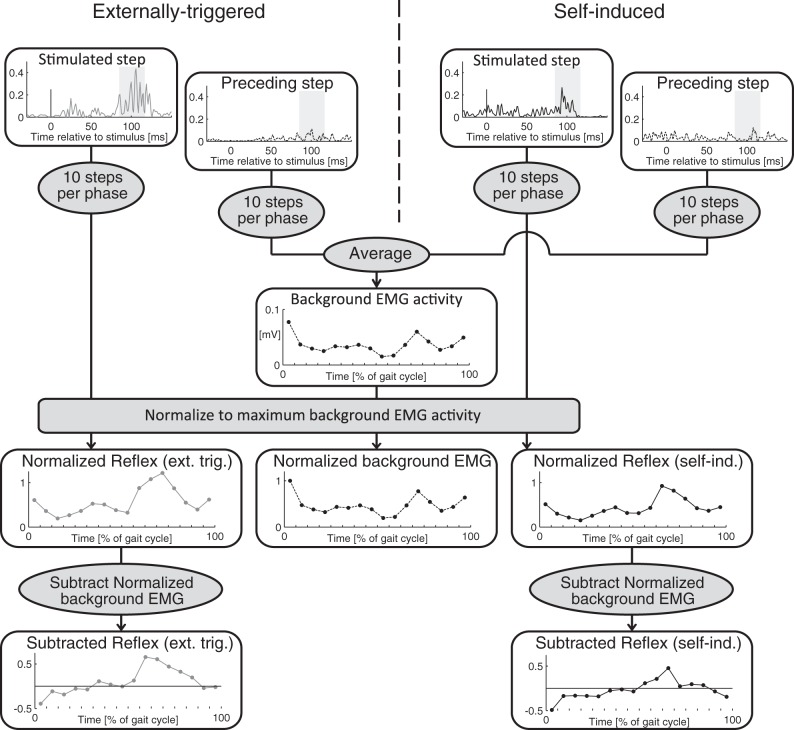
Fig. 1.
Schematic overview of the EMG data analysis procedures. Top: rectified, low-pass-filtered EMG activity. In each panel the time axis is based on the timing of the stimulus (stimulated step) or the same relative timing in the preceding gait cycle (unstimulated steps). Solid lines represent data for stimulated steps; dashed lines represent data for unstimulated steps. Gray shading on EMG traces represents the time window over which average EMG activity values were calculated. For each phase of the gait cycle we averaged the values of 10 steps. Background EMG traces were then calculated as the average of the background traces of the “externally triggered” condition (left) and the “self-induced” condition (right). Then, background and reflex EMG data were normalized to the maximum background EMG activity, displayed in the 3 panels with normalized activity (middle). Gray lines represent traces for the externally triggered condition (left); black lines represent traces for the self-induced condition (right). In a last step, we then calculated the “net” reflex amplitude by subtracting the background EMG activity from the reflex EMG activity (bottom).

