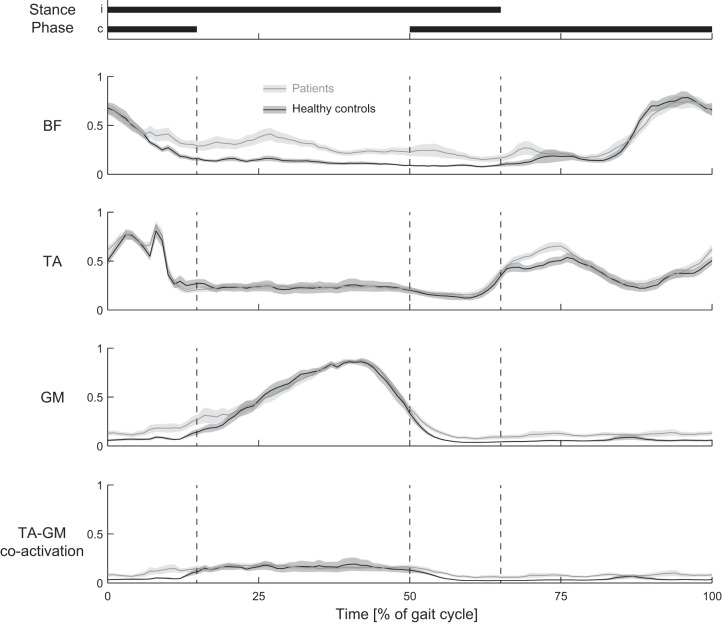
Fig. 3.
Comparisons of muscle activity and coactivation traces between cerebellar patients and healthy control subjects: muscle EMG activity for cerebellar patients (gray line) and healthy control subjects (black line). Shaded areas show SE. Durations of the stance period for the ipsilateral (i) and contralateral (c) legs are displayed at top. BF, biceps femoris; TA, tibialis anterior; GM, medial gastrocnemius. Bottom: coactivation between TA and GM for cerebellar patients (gray line) and healthy control subjects (black line). Coactivation was calculated sample by sample based on the normalized muscle activity (mean of both legs) using TA-GM coactivation = [(aH + aL)/2] × (aL/aH), where aH represents the activity of the muscle that has the highest activity during that phase (i.e., either TA or GM) and aL represents the activity of the other muscle during that phase (Mari et al. 2014).

