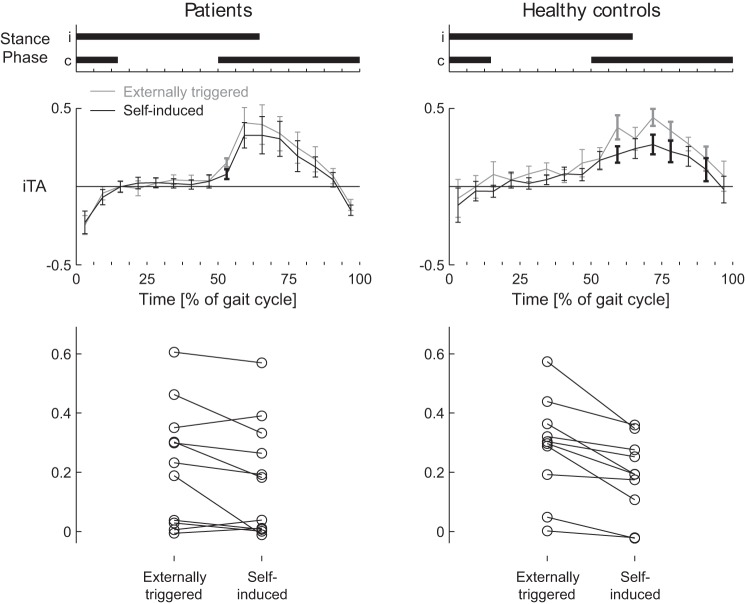
Fig. 5.
Attenuation of self-induced reflex responses in cerebellar patients and healthy control subjects: normalized subtracted reflex EMG activity for cerebellar patients (left) and healthy control subjects (right). Durations of the stance periods for the ipsilateral and contralateral legs are displayed at top. Middle: self-induced reflexes are shown in black, externally triggered reflexes in gray. Error bars show SE. Bold data points and error bars indicate phases when self-induced reflex activity is significantly attenuated. Bottom: individual data for externally triggered and self-induced reflexes.

