Fig. 1.
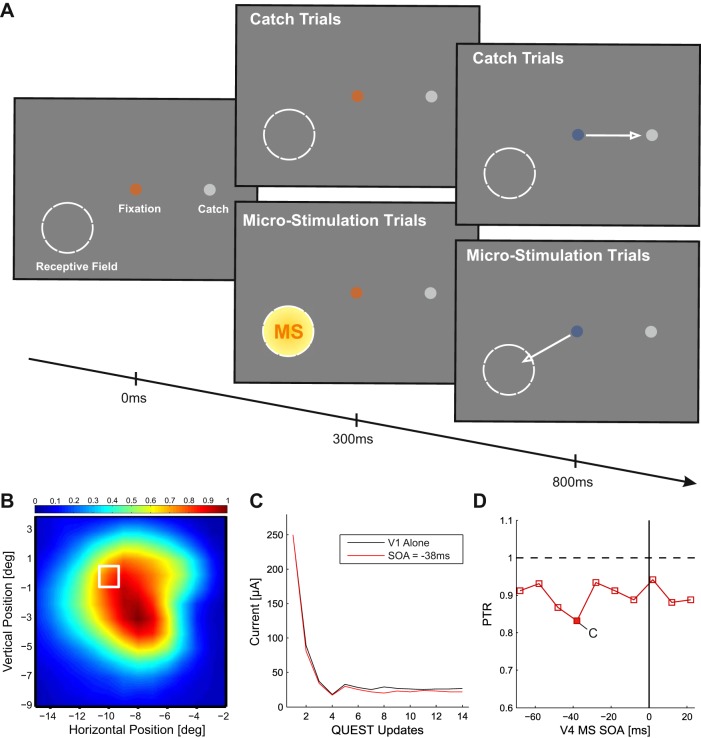
Phosphene detection task. A: after an initial period of 300 ms of fixation, a train of pulses was delivered to V1 to evoke a phosphene at the retinotopic location of the receptive field (RF) of the stimulated cells (circle). We also presented a “catch dot” that was the target of the saccade on trials without microstimulation (MS). After a delay of 500 ms, the fixation point changed color, cuing the monkeys to make a saccade. Saccades to the RF in MS trials and to the catch dot on trials without MS were followed by a juice reward. B: overlap between RFs of stimulated neurons in V1 and V4 in an example session with monkey C. White square indicates the RF of the neurons in V1; the heatmap indicates the RF of the neurons in V4. C: example of QUEST staircase that was used to determine threshold of phosphenes elicited in V1 in the V1-only (black) condition and in the V1/V4-MS condition with a stimulus-onset asynchrony (SOA) of −38 ms (red). D: relationship between the phosphene threshold ratio (PTR) in V1 and the SOA between subthreshold MS in V4 and MS in V1. Negative values on x-axis indicate that V4-MS preceded V1-MS. y-Axis shows PTR, the ratio between V1-MS detection thresholds with and without V4-MS.

