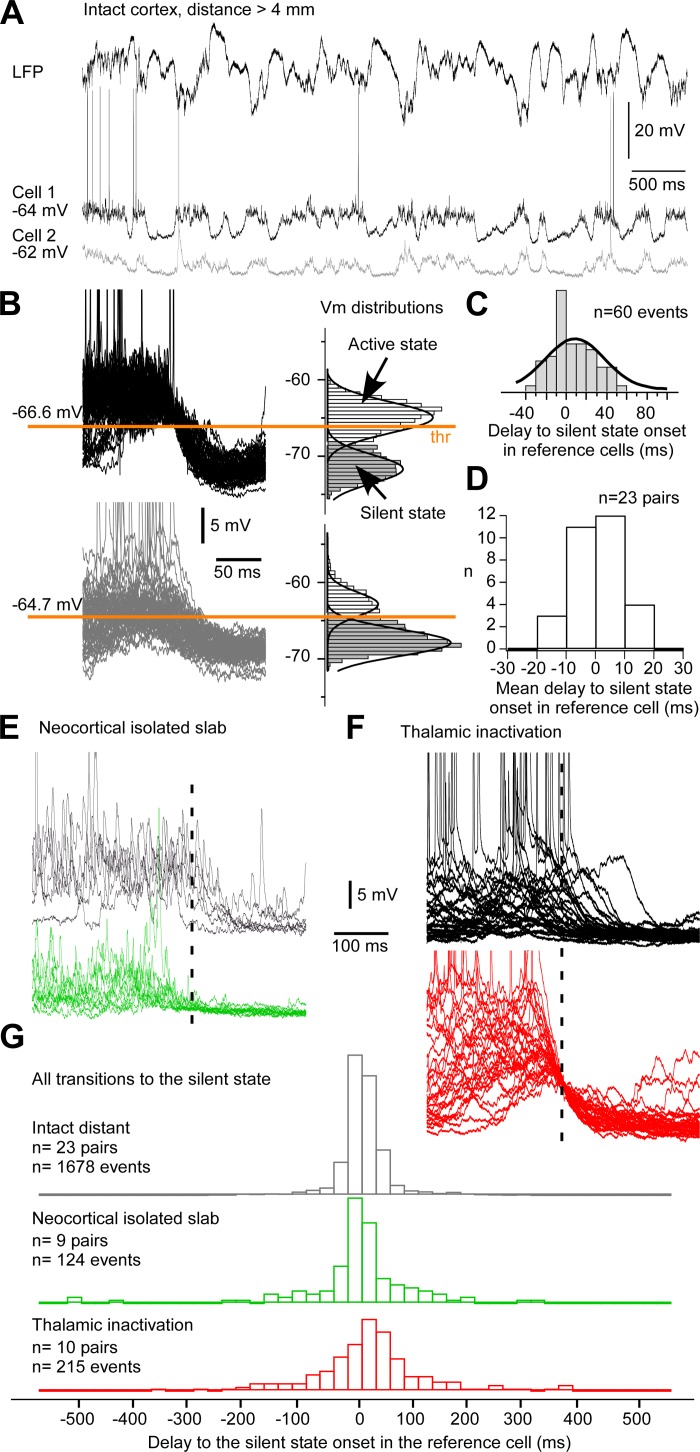
Fig. 2.
Synchrony of silent-state onset at the cellular level. A: example dual intracellular recording from the suprasylvian gyrus with a lateral distance of 4 mm. The LFP was obtained simultaneously in the same region. B: several transitions to the silent state in both cells (left) are shown with their corresponding membrane potential (Vm) distribution. The onset is defined when Vm crosses the active state threshold (thr). C: frequency histograms of the delays of the silent state onset in the gray cell (cell 2) to the onset in the black cell (cell 1). The thick black line is the Gaussian fitting of the distribution. D: histograms of mean delays in each pair. Note that the distribution is centered on zero. E: examples of silent-state onsets for 2 neurons at a distance >4 mm in the isolated neocortical slab. F: examples of superimposed transitions to the silent state for a pair of neurons at a distance <1.5 mm in the region affected by a lateral posterior nucleus inactivation. G: frequency histograms of the delays of the silent-state onset for all investigated conditions. Dashed lines in E and F indicate the crossing of the Vm threshold in cell 2.

