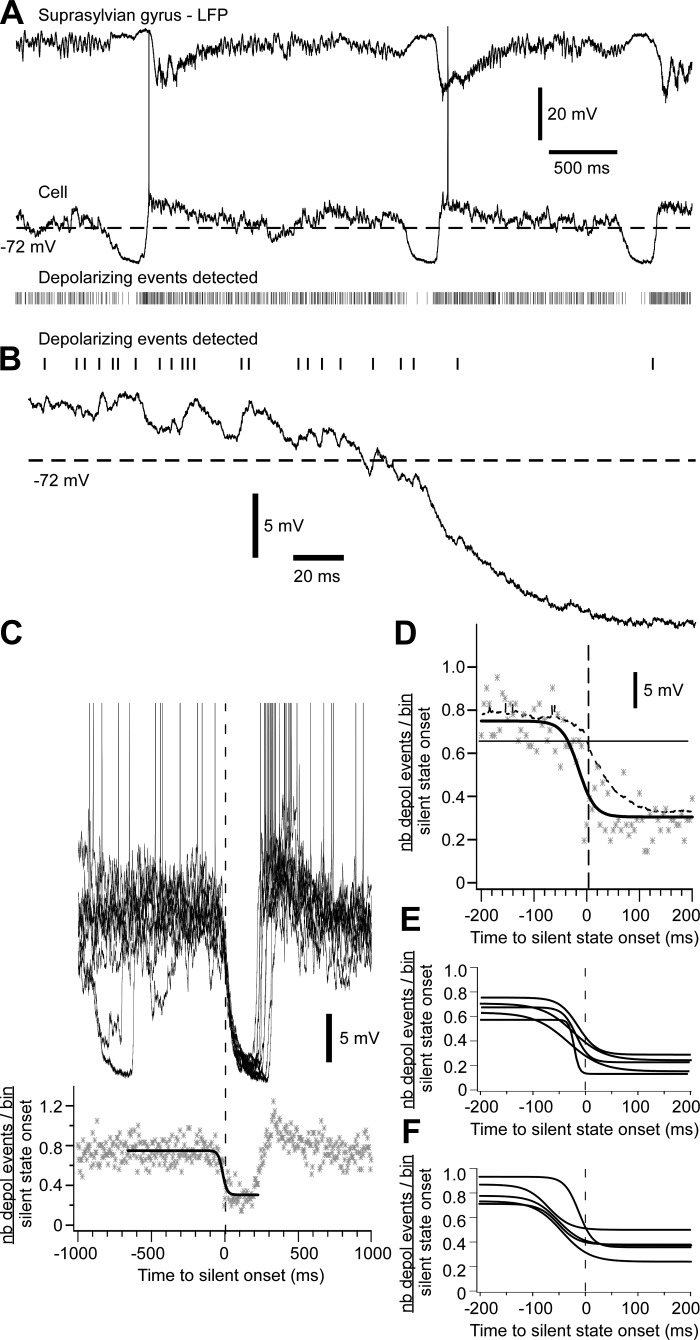
Fig. 3.
Disfacilitation preceding the silent-state onset. A: example of LFP and intracellular recordings in the suprasylvian gyrus. Raster indicates depolarizing events detected in the intracellular trace. The dotted line is the Vm threshold used to define the onset of the silent state. B: examples of depolarizing events detected. C: 10 superimposed traces aligned on the onset of the silent state are shown (top). Graph (bottom) shows the number of depolarizing events per bin of 5 ms normalized to one silent-state onset (n = 41). Data are fitted with a sigmoidal curve (thick black line). Data are expanded ±200 ms around the silent-state onset in D. Note that the sigmoidal fitting of the number of depolarizing events precedes variation of the Vm. Sigmoidal fitting of 5 cells recorded under ketamine-xylazine anesthesia (E) and during natural sleep (F) are shown.

