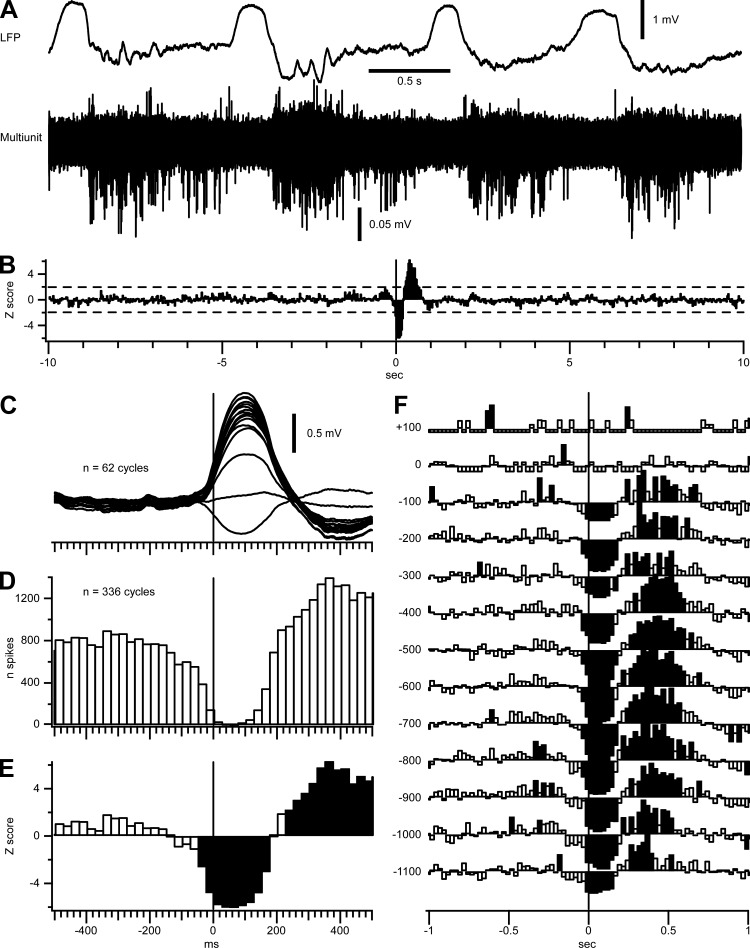
Fig. 4.
Decrease in populational cortical firing before the onset of silent states. A: deep LFP recorded during natural sleep of a cat (top) and superimposition of 16 filtered (0.5–10 kHz) LFP recordings for multiunit activities (bottom). Recordings were performed using a linear 16-channel silicon probe with recording sites separated by 100 μm; the probe was inserted perpendicularly to the cortical surface. Note the decreased firing toward the end of active states. B: z-score of multiunit firing triggered by silent-state onsets (n = 336). Mean and SD used for the z-score were calculated ±10 s from the silent-state onset. The dotted line represents z = ±1.96 (α = 0.05). C: wave-triggered averages of the LFPs recorded from a 16-channel silicon probe during one sleep episode. The deepest recording was used to detect the onset of silent states. D: perievent histogram of cortical firing calculated from 336 cycles from 5 sleep episodes (bins = 25 ms). E: close-up of B around the silent-state onset. F: z-score of the cortical depth profile of the significant variation of firing around silent-state onsets. Y-axis represents the cortical depth; depth 0 represents the depth at which the slow wave reversed and was used to align the recording depth from the 5 sleep episodes. Only depths with 5 recordings were used to calculate the depth profile z-score. For E and F, significant values are shown as filled bins; note the significant decreased firing starting 50 ms before onset of silent state.

