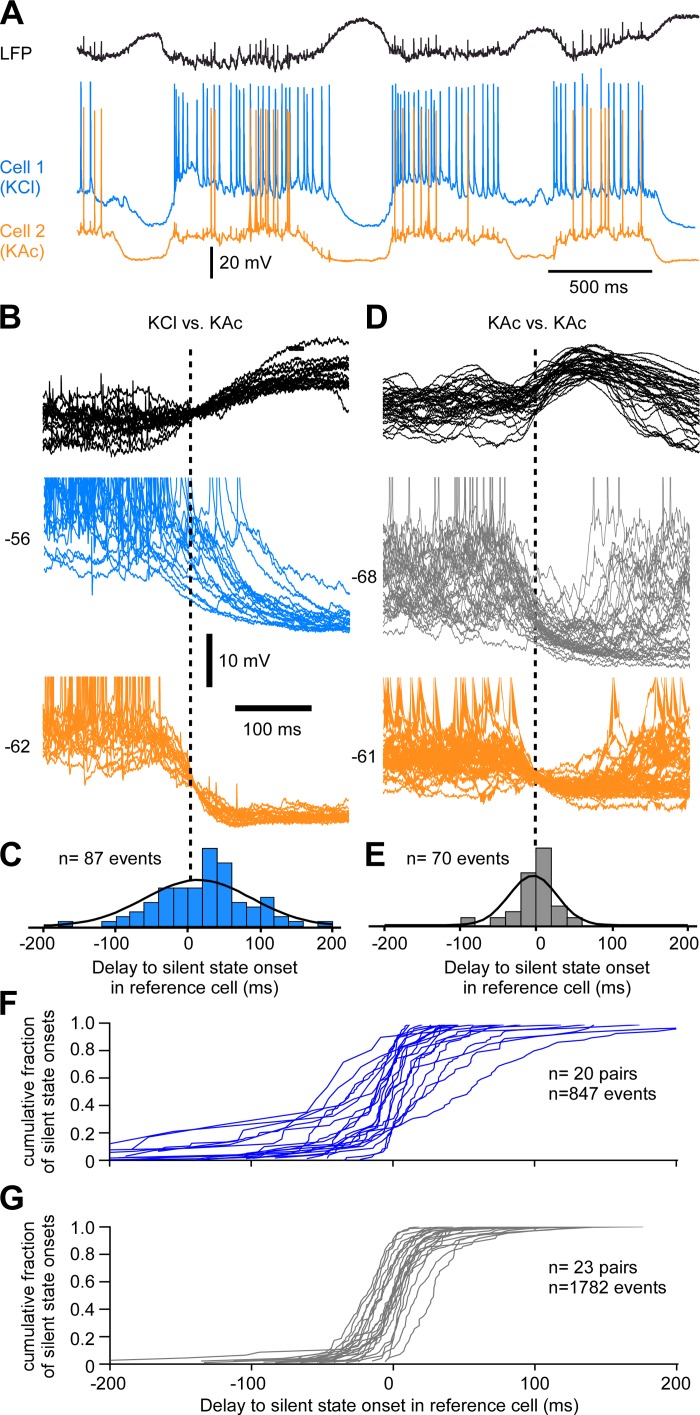
Fig. 5.
Chloride inhibition at the transition to the silent state. A: example of LFP and dual intracellular recordings of closely located (<0.5 mm) neurons. Cell 1 is recorded with a pipette filled with KCl (2 M) and cell 2 (reference cell) with a pipette filled with potassium acetate (KAc; 2 M). B: several superimposed examples of the transition to silent state triggered on the reference cell. Note the increased delay to silent-state onset in cell 1. C: frequency histogram of delays to the silent-state onset in cell 1 (KCl) compared with cell 2. D: example of 2 cells recorded with KAc closely located. E: frequency histogram of delays to the silent state. F: cumulative density functions for each KCl-KAc pair. G: cumulative density functions for each KAc-KAc pair. In B–E, the neuron indicated by orange color was used as reference cell and the silent-state onsets are indicated by a vertical dashed line.

