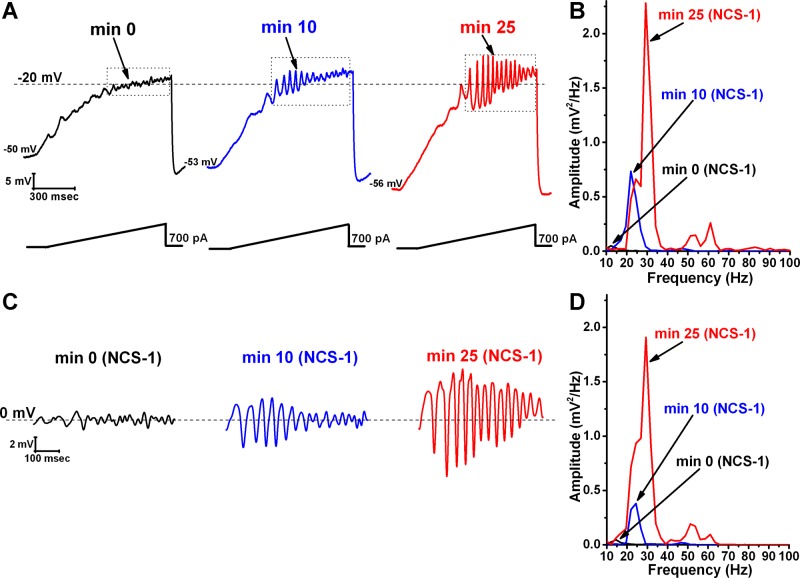
Fig. 1.
Effects of neuronal calcium sensor protein-1 (NCS-1) at 1 μM on ramp-induced oscillations in pedunculopontine nucleus (PPN) neurons. A: representative 1-s long current ramp-induced oscillations in a PPN neuron in synaptic blockers (SB) + tetrodotoxin (TTX) extracellular solution and 1 μM NCS-1 in the recording pipette (left, black record). After 10 min of NCS-1 diffusing into the cell, the oscillatory activity increased slightly (middle, blue record). However, after 25 min of NCS-1 diffusion both oscillation amplitude and frequency were increased (right, red record). B: power spectrum of the records shown in A before band-pass filtering, showing the increased amplitude and frequency of oscillations after 25-min exposure to 1 μM NCS-1. C: records enclosed by the dotted boxes shown in A after band-pass filtering (high pass 10 Hz, low pass 120 Hz). D: power spectrum of the records shown in C after band-pass filtering. Dashed lines in A represent the −20-mV membrane potential and dashed lines in C represent the 0-mV membrane potential. The small decrease in power may be due to the use of filtering.

