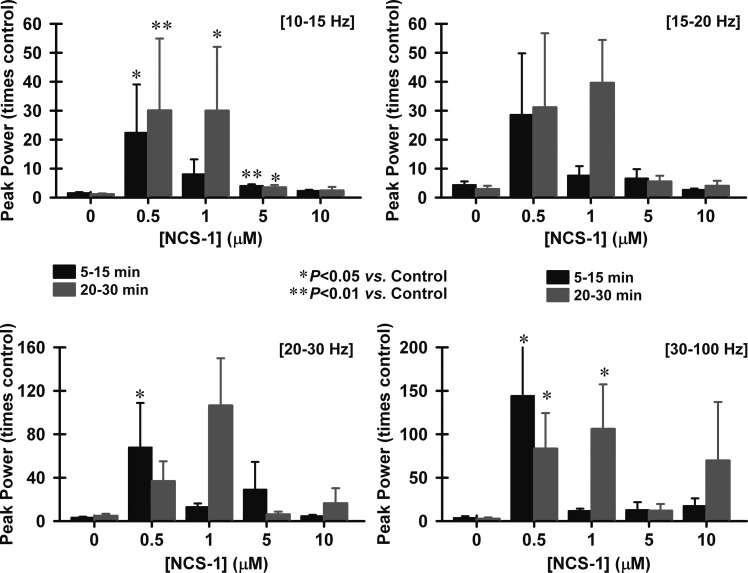
Fig. 3.
Effects of NCS-1 on peak power at various frequencies over time. The bar graphs show peak power changing over time at different frequencies as NCS-1 diffused into the cell. Peak power was calculated in the range of 10–15 Hz (alpha, top left), 15–20 Hz (alpha-beta, top right), 20–30 Hz (beta, bottom left), and 30–100 Hz (gamma, bottom right). The black bars represent the time point 5–15 min, and the gray bars represent the time points 20–30 min. *P < 0.05; **P < 0.01. In general, 1 μM NCS-1 significantly increased power at 10–15 Hz and at 30–100 Hz after 20–30 min. There were also variable effects of 0.5 μM NCS-1, with increases at 10–15 Hz at both time points, also at 20–30 Hz, but only after early exposure (5 min), but not later (20–30 min), and at 30–100 Hz but only at 20–30 min.

