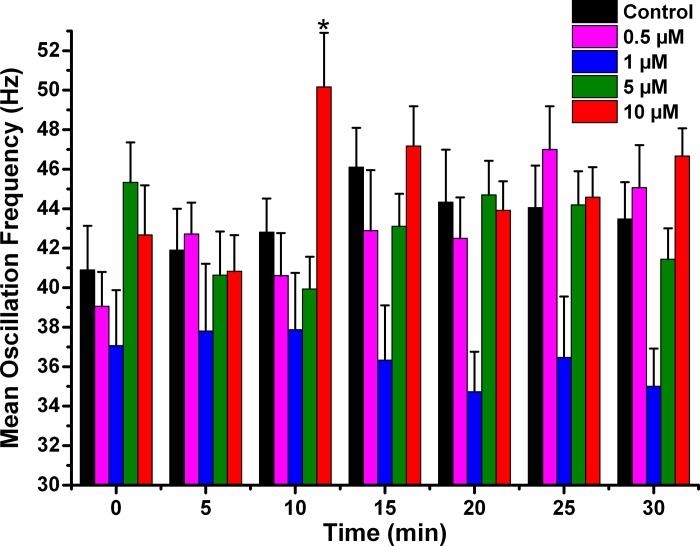
Fig. 4.
Effects of NCS-1 on mean peak oscillation frequency over time. The bar graphs show the mean peak frequency calculated from the same three oscillations used to measure peak amplitude. Control cells recorded without NCS-1 shows no significant change over time in mean peak frequency (black bars). Cells recorded using 0.5 μM NCS-1 also showed no significant changes over time (pink bars). Cells recorded using 1 μM NCS-1 did not show changes over time (blue bars), similarly to those recoded using 5 μM NCS-1, which showed no changes (green bars). However, there was an early significant increase in mean peak frequency at 10 min when using 10 μM NCS-1 (red bars). This transient effect did not persist. *P < 0.05.

