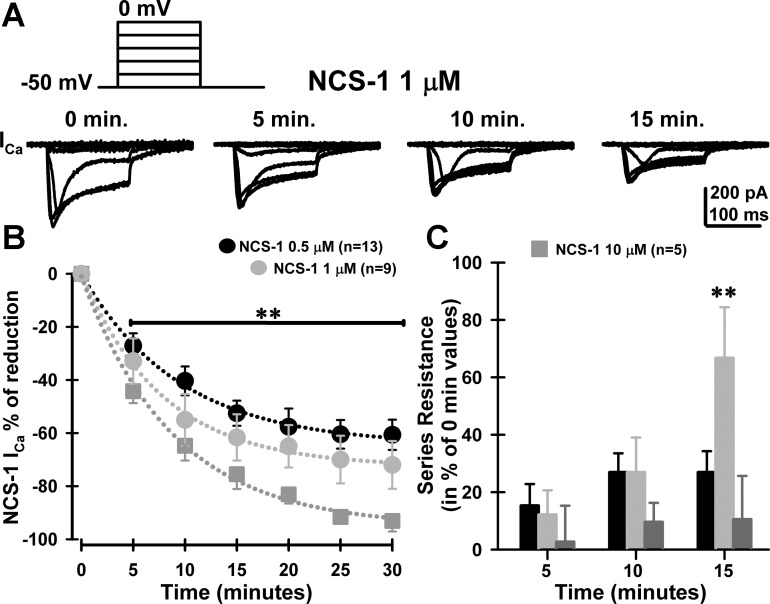
Fig. 6.
Effects of NCS-1 on voltage-dependent calcium currents (ICa) in PPN cells. A: representative ICa recorded using 5 depolarizing square steps from −40 to 0 mV from −50-mV holding potential over time (0, 5, 10, and 15 min of exposure) using 1 μM NCS-1. B: mean time course of ICa block by intracellular 0.5 μM (black circles; n = 13 PPN neurons), 1 μM (light gray circles; n = 9 PPN neurons), and 10 μM (dark gray squares; n = 5 PPN neurons). Data points were fitted to a single exponential decay yielding tau (τ) values of 9.4, 7.8, or 8.8 min for 0.5-, 1-, or 10-μM NCS-1 curves, respectively. **P < 0.001, Kruskal-Wallis one-way ANOVA, df = 2, H > 102, comparing 10-μM to 0.5-μM and 1-μM %block after 5 min of NCS-1 exposure. C: series resistance change (in % of 0-min values) observed at 5, 10, and 15 min after exposure to either 0.5 μM NCS-1 (black bars), 1 μM NCS-1 (light gray bars), or 10 μM (dark gray bars) NCS-1. Series resistance values reached a plateau after 15 min, when using 1 μM NCS-1. **P < 0.001, one-way ANOVA, F(2,25) = 60; post hoc Bonferroni t-test, 1 vs. 10 μM, t = 9, P < 0.001; 1 vs. 0.5 μM, t = 9.9, P < 0.001; 1 vs. 0.5 μM, t = 1.3, P > 0.05.

