
Fig. 5.
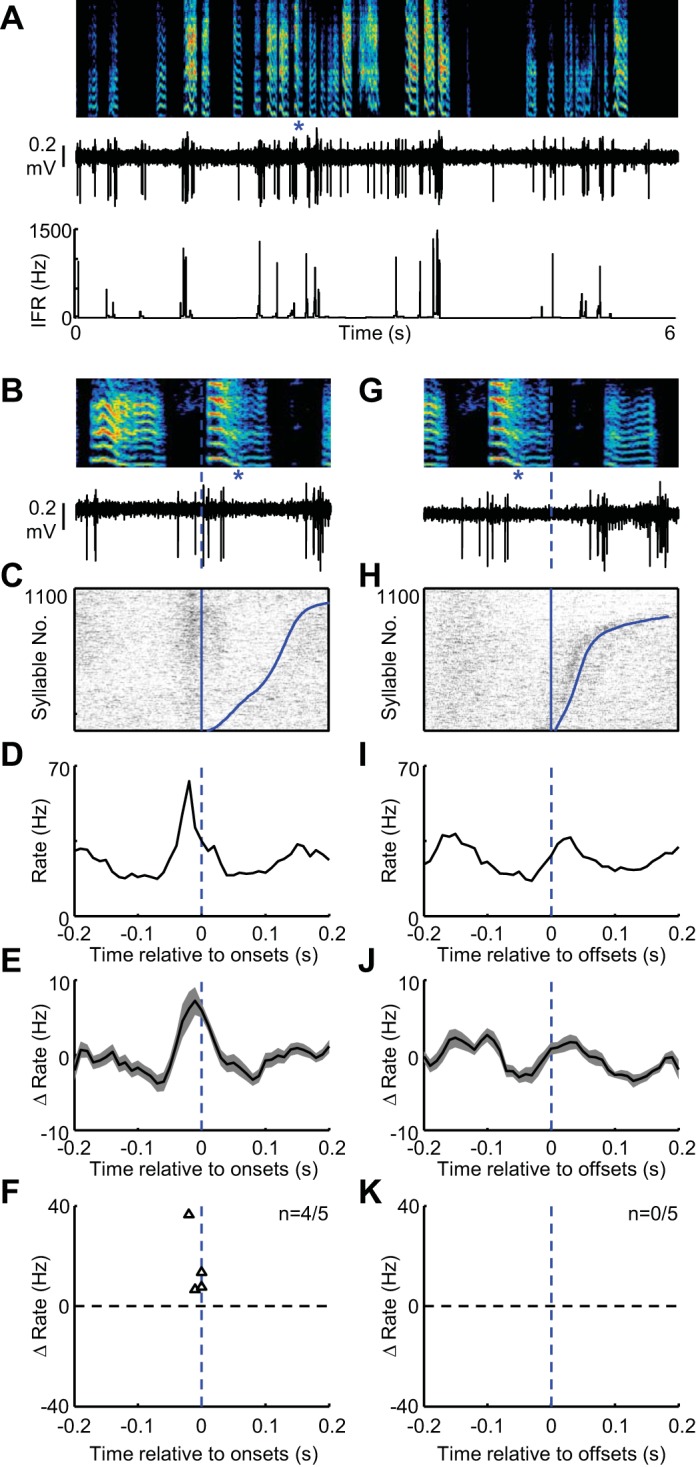
Putative FS interneurons in area X exhibit rate increases at syllable onsets during vocal babbling. A: spectrogram showing vocal babbling of a juvenile bird is shown above the spiking activity (middle) and IFR (bottom) of a single FS neuron recorded in area X. B: expanded view of song (top) and spiking activity (bottom) aligned to the onset of a single syllable (marked with blue asterisks). C: syllable onset aligned raster plot showing the spiking activity of this neuron during 1,100 syllable renditions. The data are sorted by the duration to the syllable offset (curved blue line at right of raster). Tic height in the raster is 3 syllables. Syllable onset-aligned rate histograms for the neuron in shown in A–C (D) and for all FS interneurons recorded in area X (shading indicates ± SE) (n = 5) (E). F: scatter plot showing the magnitude of dominant rate increases (black triangles, n = 4/5 FS neurons exhibited significant dominant rate peaks at onset) plotted against the time, relative to syllable onset, at which they occurred. Note that the x-axis is the same for B–F. G–K: data are plotted exactly as in B–E for syllable offsets. H: the syllable-offset aligned raster is sorted by the arrival time of the following syllable onset (curved blue line at right of raster). K: 0/5 FS neurons exhibited significant dominant rate peaks at offset.