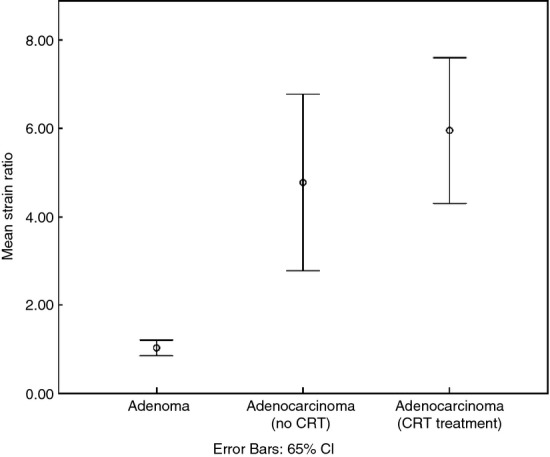
Figure 3.

Error bar chart displaying the mean strain ratio (SR) of adenomas (n = 21) and adenocarcinomas that did (n = 61) or did not (n = 38) subsequently receive neoadjuvant radiotherapy, respectively. Adenomas were significantly different from both groups of adenocarcinomas (P < 0.001, one-way ANOVA). The mean SR of adenocarcinomas allocated to neoadjuvant treatment was not significantly different from that of adenocarcinomas treated with surgery alone (P = 0.38, one-way ANOVA). CRT, chemoradiotherapy.
