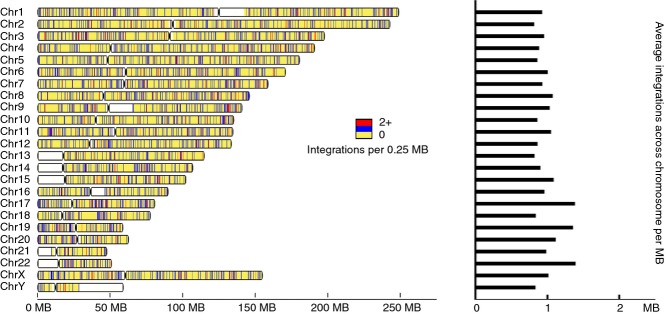
Figure 2.

Human betaretrovirus integration sites. (a) HBRV integrations were mapped to human genome 19 and shown in blue as single integrations and in red for >two per 250 kb on a yellow background for known human chromosomal regions, where white represents unsequenced regions. The density of integration sites per Mb averaged across the chromosome is displayed in the histogram.
