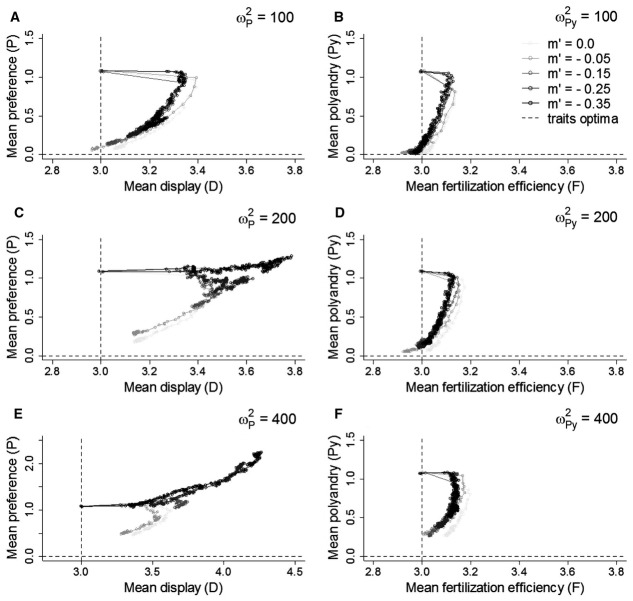
Figure 3.
Effect of negatively biased mutations (m′) in the male trait on coevolution between preference (P) and display (D; A, C, E), and between polyandry (Py) and fertilization efficiency (F; B, D, F), for three different magnitudes of direct selection on P and Py (ω2P and ω2Py). Mean phenotypic values are averaged over 50 replicate simulations, plotted every 50 generations until generation 1000 and every 100 generations thereafter. Dashed lines indicate the traits’ optima.

