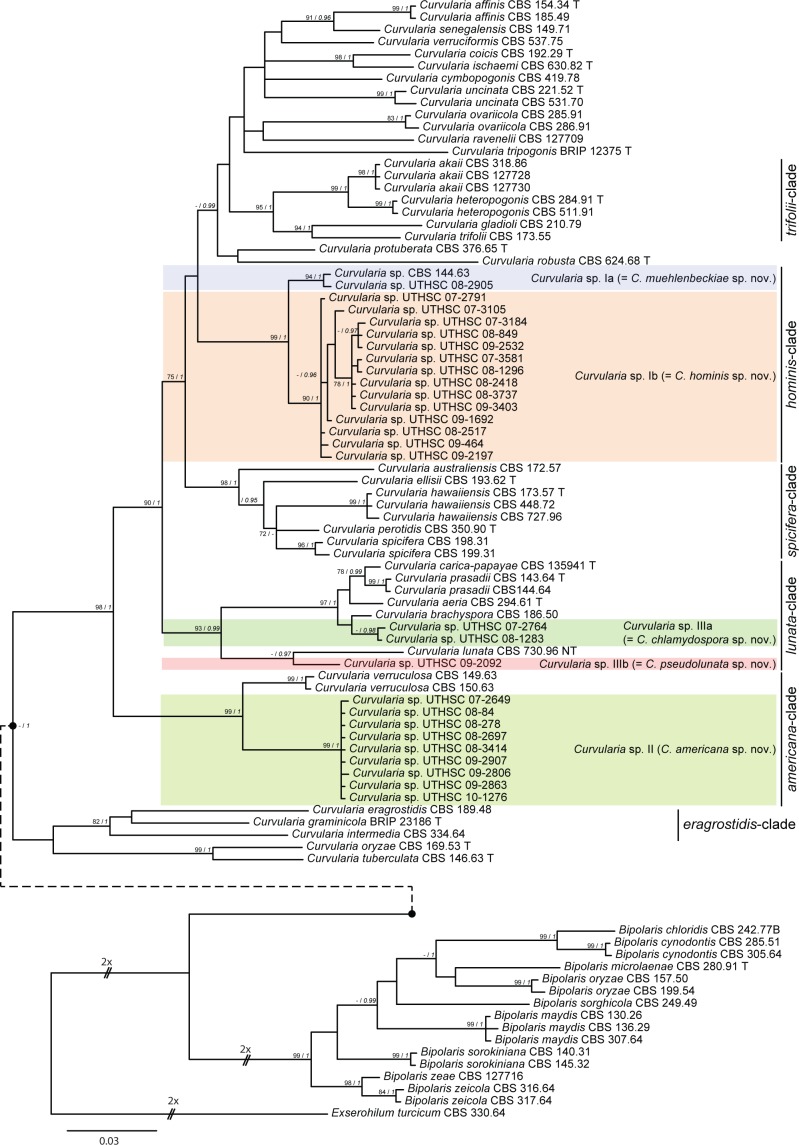
Fig. 1.
Bayesian consensus tree obtained from the combined ITS, LSU, gpd and RPB2 alignment of Curvularia and related genera. The scale bar represents the average number of substitutions per site. Bootstrap values ≥ 70 % and posterior probabilities ≥ 0.95 (in italics) are given near the internodes. The new species proposed in this study are shown in the coloured boxes. Ex-type and ex-neotype isolates for each species are indicated with a ‘T’ or ‘NT’, respectively, after the isolate number.

