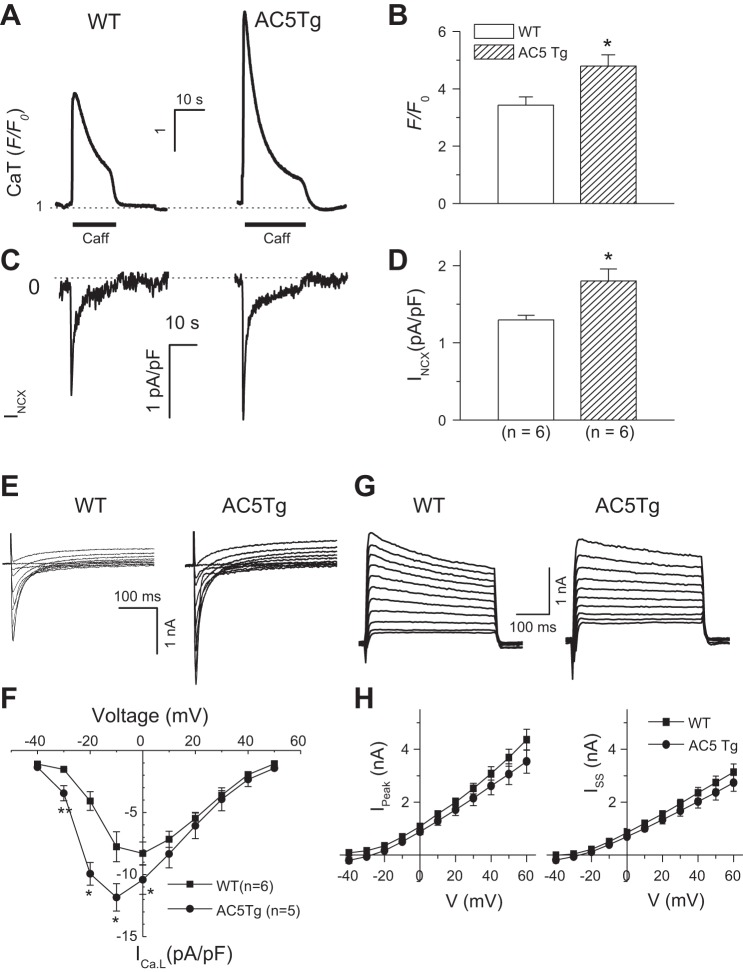
Fig. 3.
Alterations in membrane currents in AC5Tg myocytes. A and B: caffeine (Caff; 10 mM)-induced Ca2+ transients (i.e., SR Ca2+ contents) and INCX in AC5Tg (n = 6) vs. WT myocytes (n = 6). C and D: simultaneously recorded INCX in the same cells as in A and B. E and F: representative current traces of L-type Ca2+ current (ICa,L) and current-voltage (I-V) relations recorded from AC5Tg vs. WT myocytes. G and H: representative current traces of outward potassium current (IK) and I-V relations for both peak (Ipeak) and steady-state currents (Iss) recorded from AC5Tg (n = 6) vs. WT myocytes (n = 6). *P < 0.05 compared with WT control myocytes. Myocytes used in the observations were from 3–5 mice in each group.

