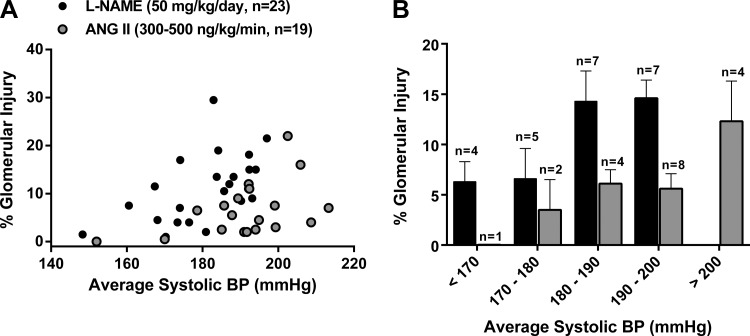
Fig. 3.
A: relationship between systolic BP (averaged over 4-wk hypertension) and total glomerular injury (in %) in rats administered l-NAME versus ANG II. Whereas no significant differences were observed with respect to the slope of this relationship (l-NAME: 0.31 ± 0.11 vs. ANG II: 0.19 ± 0.09), significant (P < 0.001) differences were seen with respect to the x-intercept when y = 0 (l-NAME: 145 mmHg vs. ANG II: 156 mmHg). B: relationship between total glomerular injury (in %) and the corresponding 4-wk average systolic BP plotted within 10-mmHg systolic BP bins (n = number of rats whose BP fell within the corresponding 10-mmHg BP range). Values are expressed as means ± SE. *P < 0.05 vs. ANG II.

