
Fig 1.
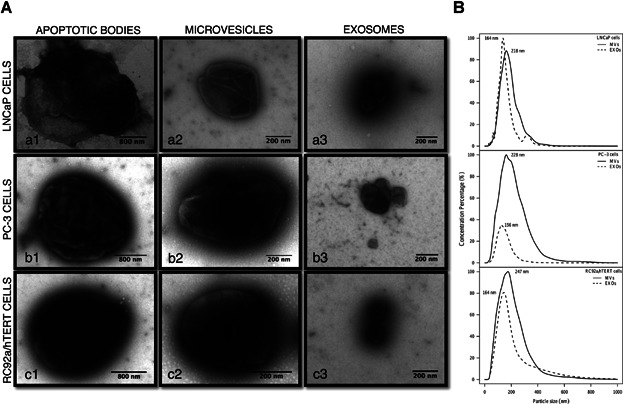
Characterization of cell-derived extracellular vesicle subpopulations. A: Representative transmission electron microscopy images of different EV populations: apoptotic bodies (a1–c1), microvesicles (a2–c2) and exosomes (a3–c3) released from LNCaP, PC-3, RC92a/hTERT cell lines. The scale bar is included in each picture. B: Size distribution graphics of microvesicles (MVs) and exosomes (EXOs) derived from LNCaP, PC-3, and RC92a/hTERT cells were determined by NTA using Nanosight software. The mean particle size for each population is represented.