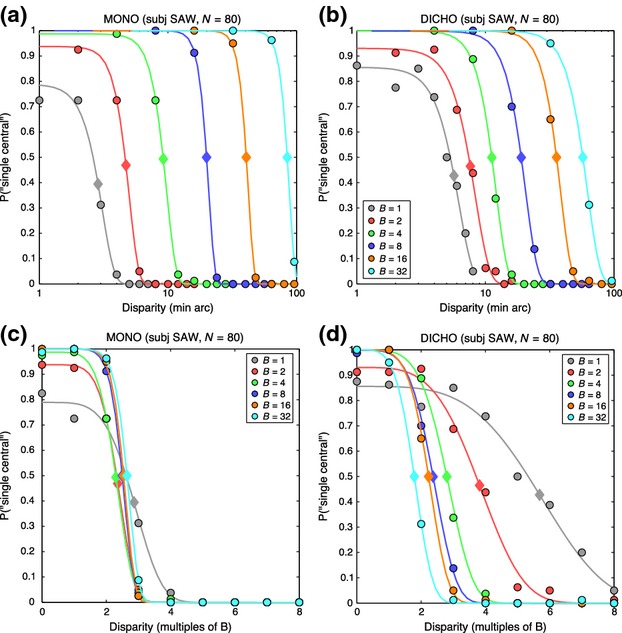
Figure 5.

Experiment 1. Data from the 2-choice procedure for one observer (SAW). (a) Monoptic condition (both edges in the same eye). Symbols show the proportion of trials on which the observer reported a single, central edge, as a function of absolute disparity (in min arc, log scale). Different colours represent different edge blurs, in min arc, as shown. Smooth curves are the fits of a generalised Gaussian function (see text). Diamond symbols on the curves lie at half the peak height of each fitted curve, estimating the disparity range for single-central responses. (b) Similar to (a), for dichoptic edges. The absolute disparity range increased markedly with the scale (blur) of the edge. (c, d) Same data as (a, b), but with disparity re-plotted as a multiple of the blur B. Scale invariance was more evident for the monoptic task (c) than the dichoptic (d).
