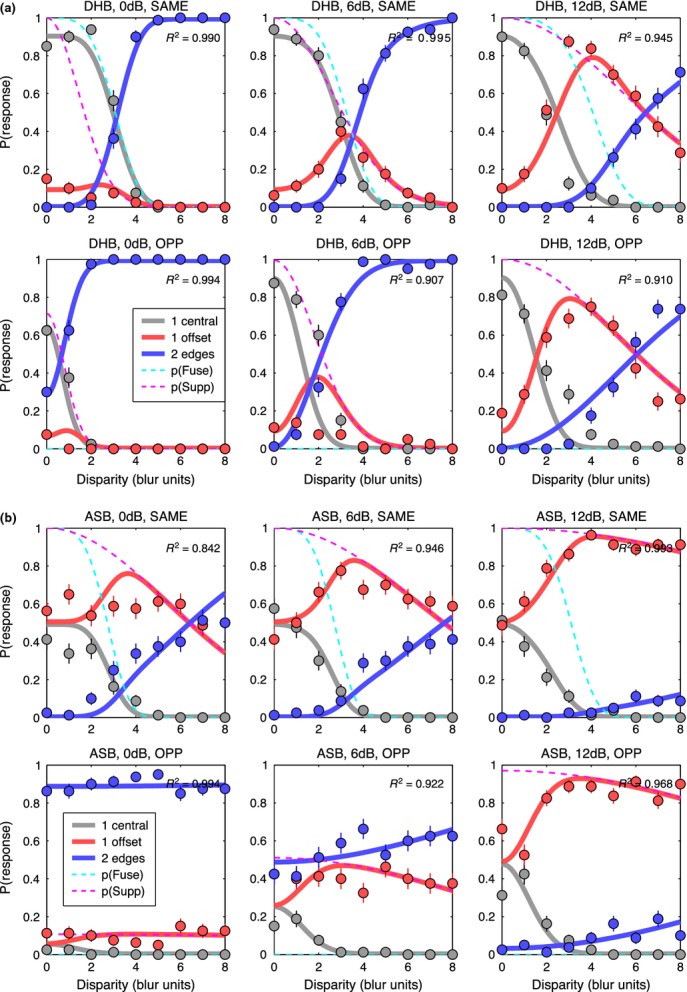
Figure 12.

Experiment 3, edge blur 8 min arc only. Like Figure 7, proportion of each response type is plotted against disparity. Contrast imbalance (0, 6, 12 dB) increases across columns from left to right (interocular contrast ratios of 1, 2, 4). Note how reports of two edges (blue symbols) fell markedly when the two contrasts became unequal (second & third columns). (a) observer DHB. (b) observer ASB. Smooth solid curves show the fit of the model, assuming fusion for edges of the same polarity (top row in a, b), but not for opposite polarities (bottom row in a, b). Fitting had four free parameters; criterion and noise were fixed for each observer directly from experimental data (Figure 11). For disparities within the fusion range (about 0–3.B), diplopia was strong for opposite polarities, especially when contrasts were equal. This is consistent with an absence of fusion for opposite polarities.
