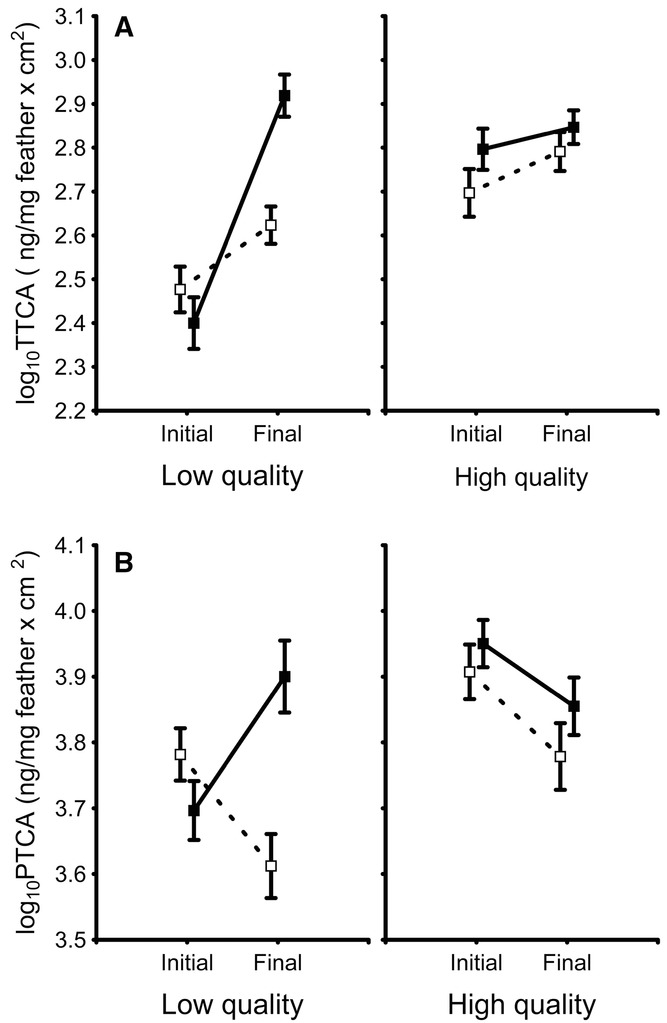
Figure 5.

Change in pheomelanin levels (TTCA levels multiplied by bib size; A) and eumelanin levels (PTCA levels multiplied by bib size; B) in bib feathers of male house sparrows of low and high quality during the course of the experiment. Solid symbols and lines: control birds; open symbols and dashed lines: BSO-treated birds. Values are least squares mean ± SE.
