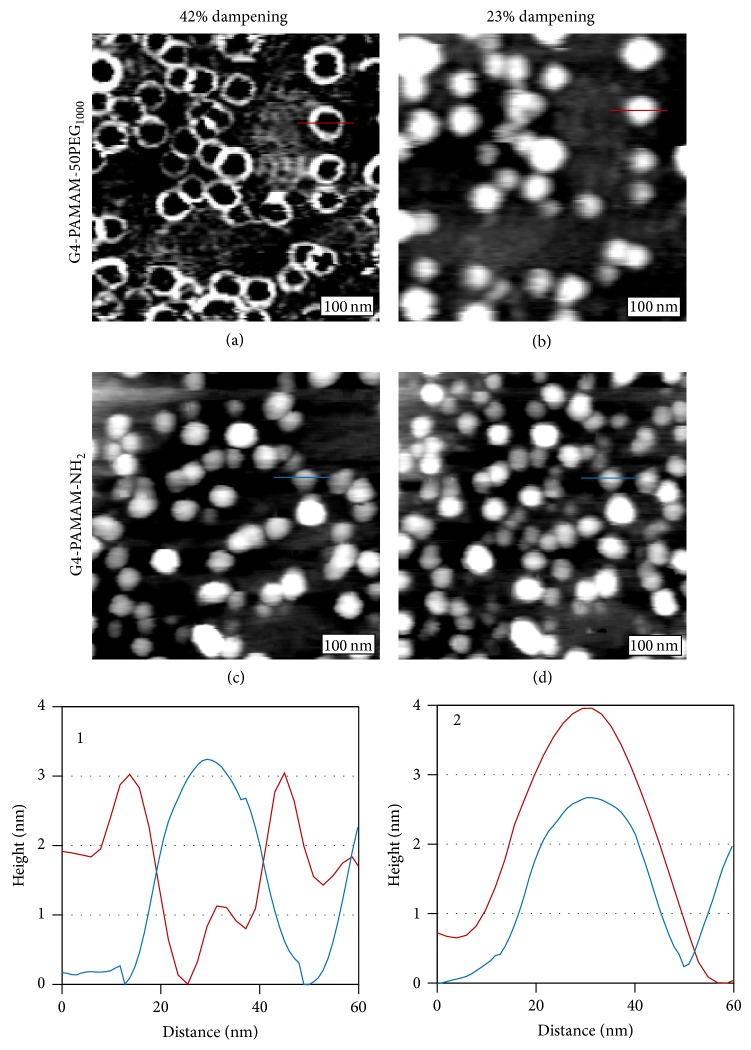
Figure 1.
AFM tapping mode imaging of G4-PAMAM-50PEG1000 dendrimers. 300 × 300 nm2 topographic images of G4-PAMAM-50PEG1000 acquired at a damping set point of 42% (a) and 23% (b). 300 × 300 nm2 AFM topographic images of G4-PAMAM-NH2 at damping set points of 42% (c), and 23% (d). Cursor profile 1 is a representative G4-PAMAM-50PEG1000 and G4-PAMAM-NH2 dendrimer imaged with 42% dampening as indicated in (a) (red) and (c) (blue). Cursor profile 2 is a representative G4-PAMAM-50PEG1000 and G4-PAMAM-NH2 dendrimer imaged with 23% dampening as indicated in (b) (red) and (d) (blue).

