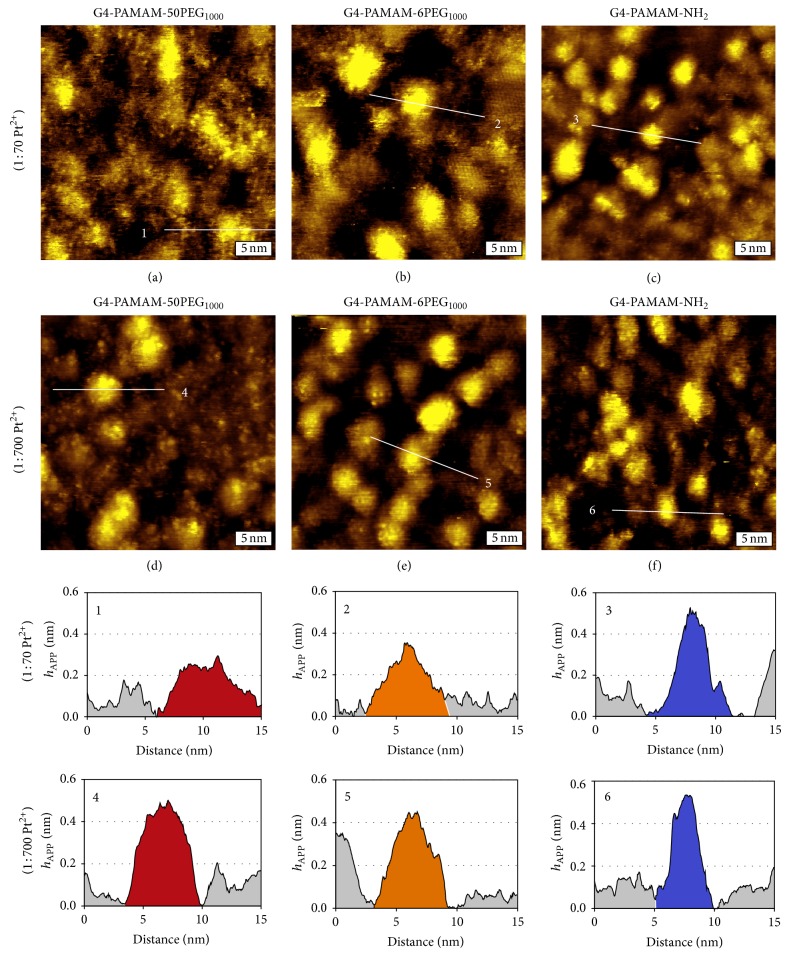
Figure 5.
High-resolution characterization of dendrimers doped at 1 : 70 and 1 : 700 dendrimer to Pt2+ molar ratios. (a–c) 15 × 15 nm2 STM topographic images of G4-PAMAM-50PEG1000, G4-PAMAM-6PEG1000, and G4-PAMAM-NH2 doped in a solution containing a 1 : 70 molar ratio of dendrimer to Pt2+. (d–f) 15 × 15 nm2 STM topographic images of G4-PAMAM-50PEG1000, G4-PAMAM-6PEG1000, and G4-PAMAM-NH2 doped in a solution containing a 1 : 700 molar ratio of dendrimer to Pt2. Cursors 1–3 provide the lateral and apparent height dimensions of individual representative G4-PAMAM-50PEG1000, G4-PAMAM-6PEG1000, and G4-PAMAM-NH2 dendrimers doped at a 1 : 70 Pt2+ ratio. Cursors 4–6 provide the lateral and apparent height dimensions of individual representative G4-PAMAM-50PEG1000, G4-PAMAM-6PEG1000, and G4-PAMAM-NH2 dendrimers doped at a 1 : 700 Pt2+ ratio. All images were acquired at 0.7–0.9 V and 20–30 pA.

