Figure 2.

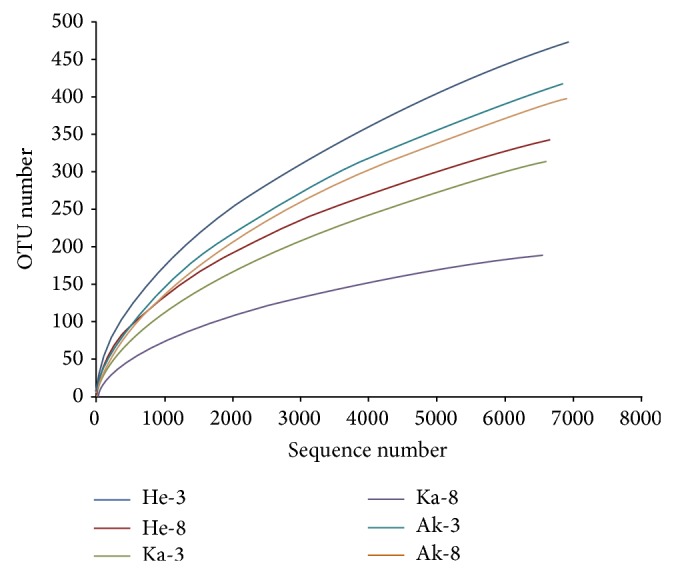
Rarefaction curves of fungal depicting the effect of 3% dissimilarity on the number of OTUs identified in the 6 soil samples.

Rarefaction curves of fungal depicting the effect of 3% dissimilarity on the number of OTUs identified in the 6 soil samples.