
Figure 2.
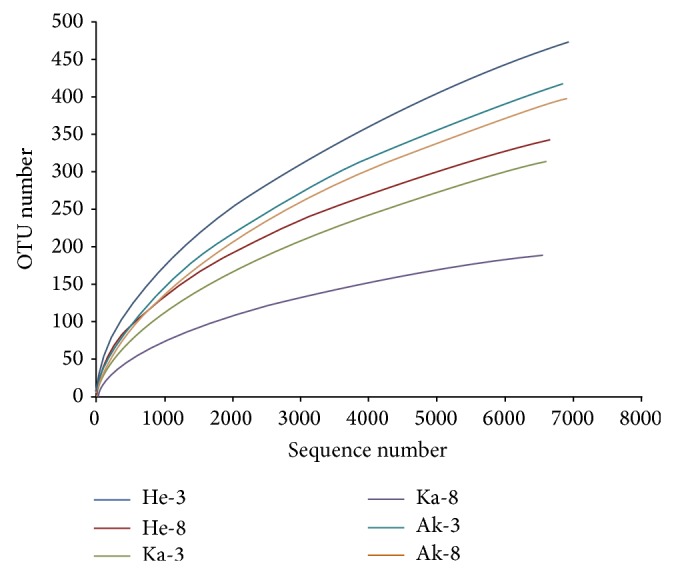
Rarefaction curves of fungal depicting the effect of 3% dissimilarity on the number of OTUs identified in the 6 soil samples.
Official websites use .gov
A
.gov website belongs to an official
government organization in the United States.
Secure .gov websites use HTTPS
A lock (
) or https:// means you've safely
connected to the .gov website. Share sensitive
information only on official, secure websites.
Rarefaction curves of fungal depicting the effect of 3% dissimilarity on the number of OTUs identified in the 6 soil samples.