Figure 5.

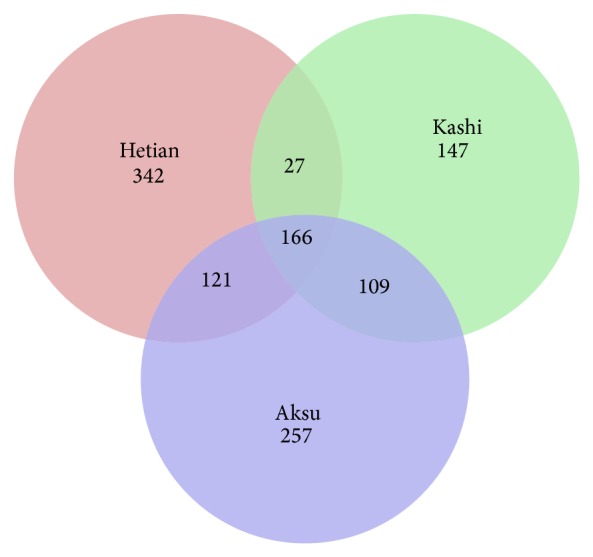
Venn diagram representing the number of fungal OTUs that are unique and shared between the samples from 3 different sampling areas.

Venn diagram representing the number of fungal OTUs that are unique and shared between the samples from 3 different sampling areas.