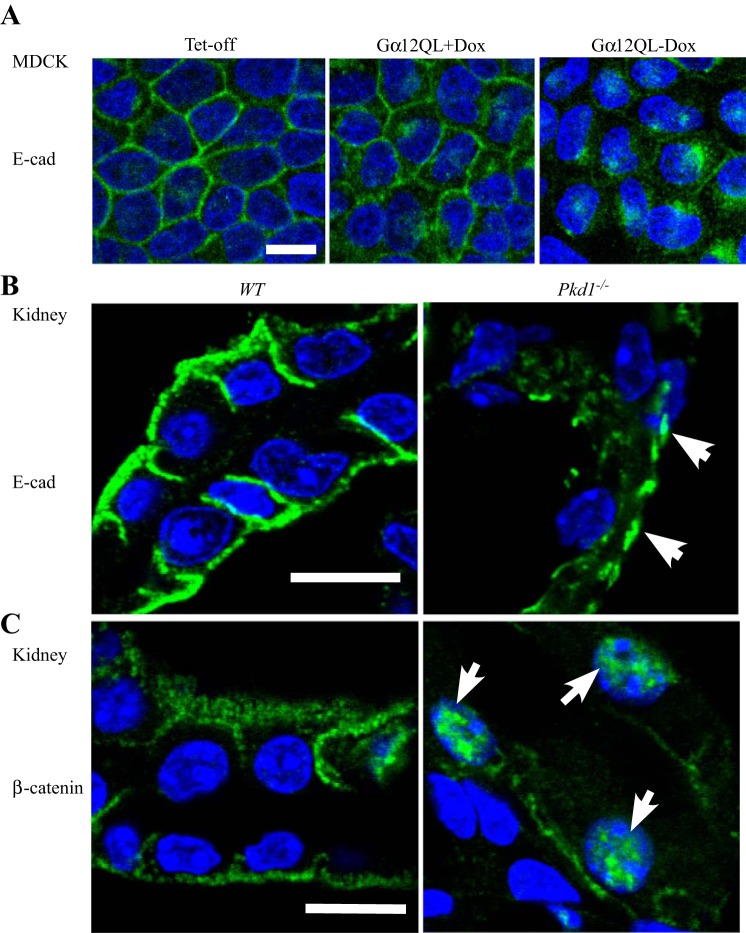
Fig. 4.
Distribution of E-cadherin and β-catenin in kidney epithelial cells. A: active Gα12 was induced for 48 h in MDCK cells. Green, E-cadherin; blue (DAPI), nucleus. Immunostaining of E-cadherin (B, white arrowheads) and β-catenin (C, white arrowheads) in the kidney tissue from WT and Pkd1−/− (null) mice. White bar: 10 μm.

