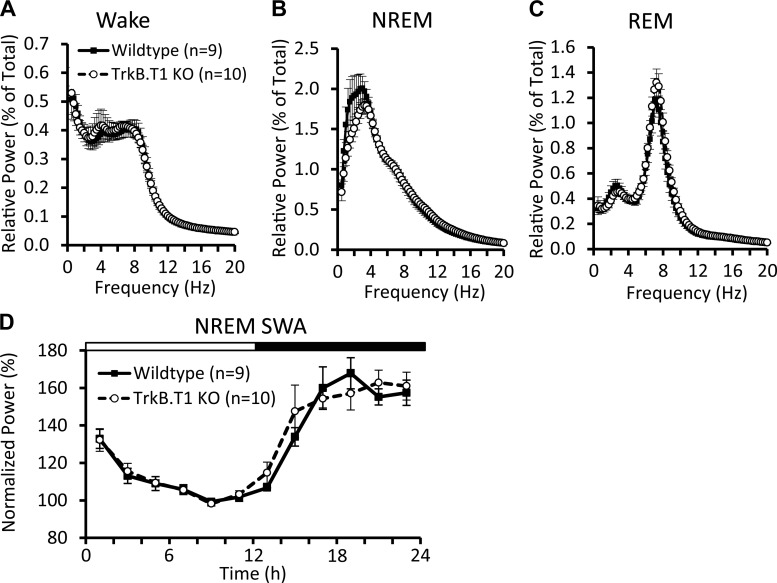
Fig. 1.
EEG power spectra and non-rapid eye movement (NREM) sleep slow-wave activity (SWA) during the baseline recording. Normalized EEG power during wake (A), NREM (B), and rapid eye movement (REM; C) sleep, expressed as a percentage of total power across all states. TrkB.T1 knockout and wild-type mice have comparable EEG spectra in all three states. D: NREM SWA across the baseline period, normalized to the NREM SWA in the final 4 h of the light phase. TrkB.T1 knockout mice show similar variation in SWA across the light-dark cycle. Values are expressed as means ± SE.

