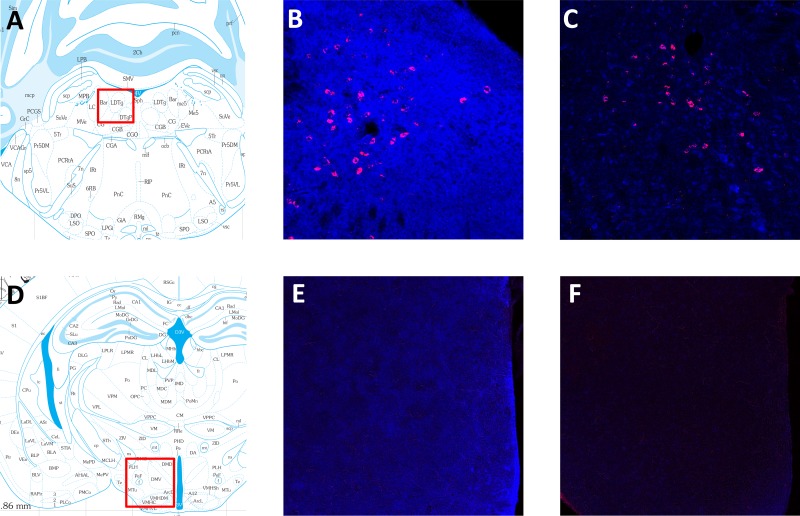
Fig. 5.
TrkB.T1 immunofluorescence in wild-type and TrkB.T1 knockout mice. A–C: TrkB.T1 (blue) and choline acetyltransferase (ChAT; red) immunofluorescence labeling in the caudal laterodorsal tegmental nucleus (LDT). A: approximate location (red box) where images of the LDT were taken. B: Wild-type mice show intense TrkB.T1 labeling around the LDT, indicated by ChAT neurons. C: labeling is at background levels in TrkB.T1 knockout mice. D–F: TrkB.T1 labeling in the lateral hypothalamus (LH). D: approximate location (red box) of images of the LH. E: wild-type mice show moderate TrkB.T1 labeling. F: labeling is at background levels in TrkB.T1 knockout mice. Atlas images in A and D were adapted from Ref. 41, and definition of additional brain regions can be found there.

