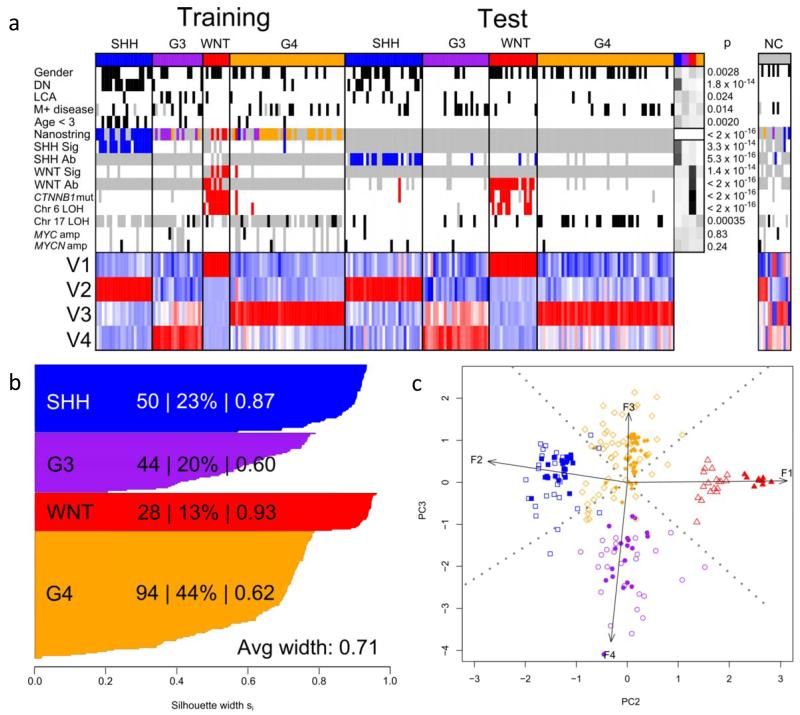
Figure 1. DNA methylomics classifies medulloblastoma into four major subgroups.
a. NMF-based consensus clustering of the training cohort (n=100) identifies 4 subgroups that are validated in the test cohort (n=130). Methylation subgroup membership (SHH, blue; G3, purple; WNT, red; G4, orange) and clinico-pathological and molecular subgroup-correlates are shown. Female gender, DN histology, LCA histology, M+ disease and age <3 years are marked in black. Nanostring assay shows transcriptomic subgroup assignment (WNT, red; SHH, blue; Group 3, purple; Group 4, orange). SHH GeXP mRNA signature positivity (SHH Sig) and SHH GAB1 IHC positivity (SHH Ab) are labeled blue. WNT GeXP mRNA signature positivity (WNT Sig), β-catenin IHC nuclear positivity (WNT Ab), CTNNB1 mutation and chromosome 6 loss (Chr6 loss) are labeled red. Chromosome 17 loss (Chr17 loss), MYC amplification and MYCN amplification are labeled black. Missing data are labeled grey. ‘Residuals’ panel displays chi-squared test residuals that indicate any over- (black) or under- (white) representation of each correlate across subgroups, and p values are shown for these relationships. Non-classifiable (NC; n = 14) tumors are also shown. Magnitudes of the 4 defining metagenes (V1 to V4) are shown; highly expressed metagenes are red, lowly expressed are blue. b. Silhouette plots demonstrate correct subgroup assignment (score >0) for 216/216 classified samples from the training and test cohorts. For each subgroup, the number of members, the percentage of cluster members and average silhouette (si) width are shown. c. Bi-plot of combined training and test datasets demonstrates reproducibility of DNA methylomic clusters across datasets. Arrows show projections of 4 metagenes along second and third principal components, labeled with their metagene number. For all clusters, training set samples are shown as filled shapes, with test samples as empty shapes (WNT, red triangles; SHH, blue squares; G3, purple circles; G4, orange diamonds).

