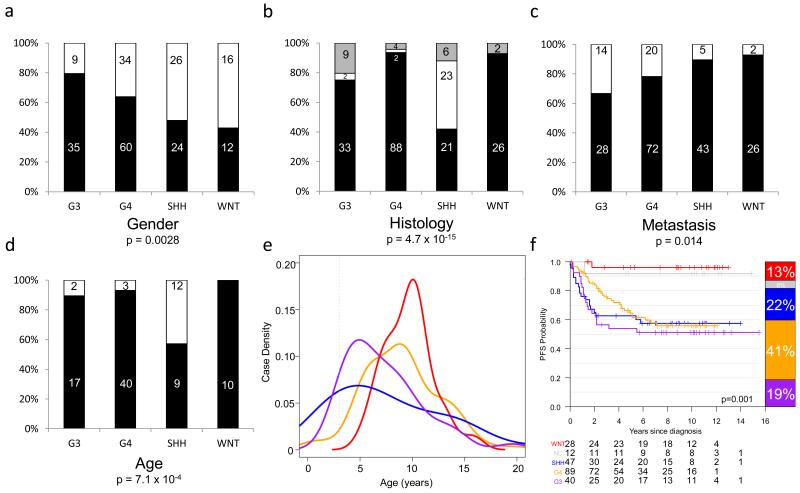
Figure 2. Clinical, pathological and outcome correlates of medulloblastoma methylation subgroups.
a-d. Number and percentage incidence are shown for each disease feature across methylation subgroups. a. Gender – male, black; female – white. b. Pathology – classic, black; LCA, grey; DN, white. c. Metastasis – M− black; M+, white. d. Age (training cohort only - test cohort did not contain infant tumors) – black, ≥3 years at diagnosis; white, <3 years. P values are from chi-squared tests. e. Age at diagnosis distribution for each subgroup. f. Kaplan-Meier plots for subgroup PFS, including NC tumors. P value, assessed by Log-Rank test, is shown; barplots to the right show subgroup incidence and at-risk tables are shown below each curve. WNT, red; SHH, blue; G3, purple; G4, orange; NC, grey. Combined data from training and test cohorts are shown except where indicated, with analyses based on patients with available data.

