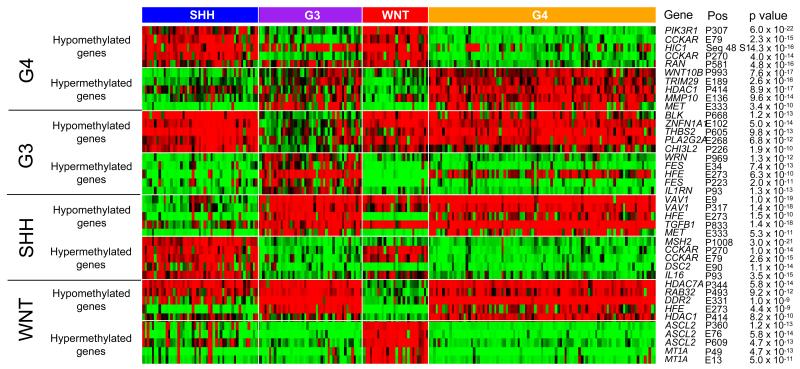
Figure 3. Gene-specific DNA methylation differences between medulloblastoma subgroups.
The top 5 most significant hyper- and hypo-methylation changes associated with each subgroup (methylated, red; unmethylated, green; partially-methylated, black). For each probe, gene name, position (P, promoter region; E, exonic region; number is distance from transcriptional start site) and BH corrected p values, assessed by Mann-Whitney U tests, are shown.

