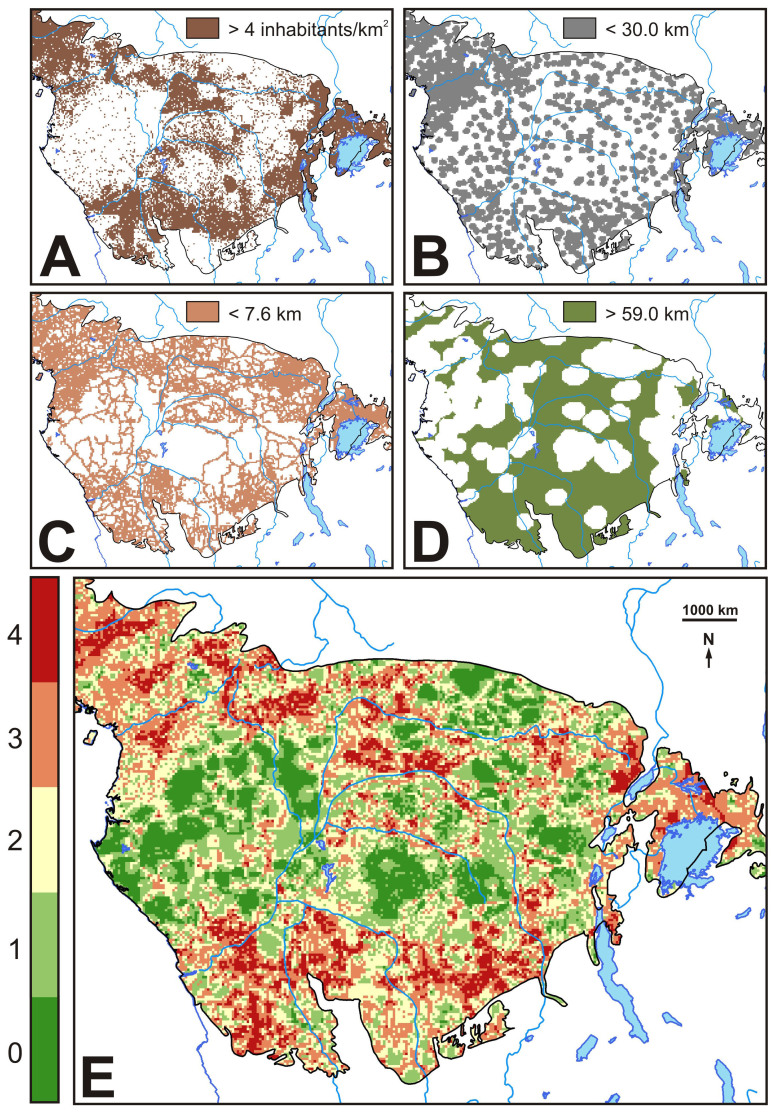
Figure 4.
Anthropogenic pressures.
(A) Brown: above median areas of rural human population density. (B) Grey: below median areas of distance to urban areas. (C) Pink: below median areas of distance to roads. (D) Green: above median areas of distance to protected areas. (E) Bushmeat extraction patterns emerging from the overlay of urban areas, road networks, protected areas and densely populated rural areas (areas with a total score of 4 had the highest bushmeat extraction potential, whereas areas with a total score of a 0 had the lowest). Maps were generated using ArcGIS.

