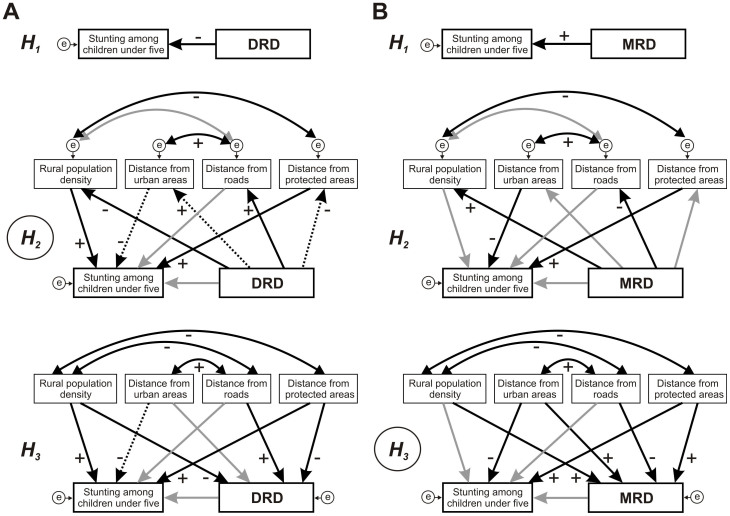
Figure 5.
Path diagrams representing relationships between diversity and stunting among children.
Three hypotheses are tested: H1 (direct relationship); H2 (diversity influences human variables and these influence stunting); H3 (human variables influence both diversity and stunting). (A) Models for Deep Rainforest Diversity (DRD). (B) Models for Marginal Rainforest Diversity (MRD). Circles enclosing "e": error terms associated to dependent variables. Solid black arrows: significant relationships (n = 60; P < 0.05); dashed black arrows: 0.05 < P < 0.07; grey arrows: non-significant relationships (P > 0.07); double arrows: covariance between variables, which are considered in the diagrams when significant correlations were identified within the study area (P < 0.05). +: Positive relationship; - : Negative relationship. Encircled hypotheses (H2 in A and H3 B) indicate the best fitted models.

