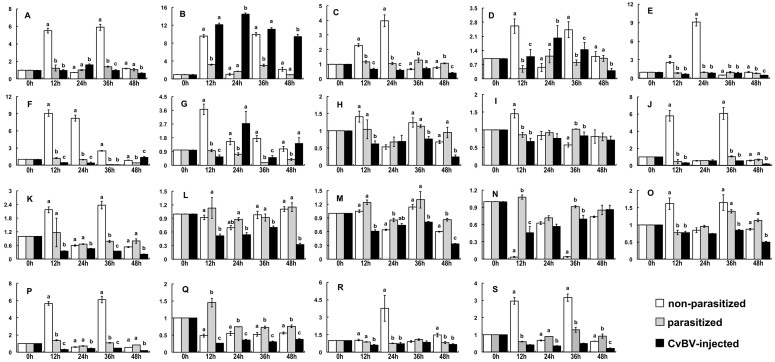
Figure 2. Relative abundances of pro-neuropeptide transcripts in B-CA-CC from control and experimental larvae.
The relative amounts of pro-neuropeptide gene mRNAs were normalized to the abundance of β-tubulin mRNAs. Pro-neuropeptide transcript levels at indicated time points pp/pi were normalized to the corresponding pro-neuropeptide gene transcript at 0 hour pp/pi. (A): pro-adipokinetic hormone I gene; (B): pro-adipokinetic hormone II gene; (C): pro-A-type allatostatin gene; (D): pro- C-type allatostatin gene; (E): pro-allatotropin gene; (F): pro-bursicon subunit α gene; (G): pro-bursicon subunit β gene; (H): pro-CCHamide gene; (I): pro-crustacean cardioactive peptide gene; (J): pro-diuretic hormone gene; (K): pro-FMRFamide gene; (L): pro-ion-transport peptide gene; (M): pro-leucokinin gene; (N): pro-neuroparsin gene; (O): pro-neuropeptide F2 gene; (P): pro-short neuropeptide F gene; (Q): pro-neuropeptide-like peptide (NLP); (R): pro-prothoracicotropic hormone gene; (S): pro-tachykinin gene. X- axis: Hours post parasitization/CvBV-injection; Y- axis: Relative transcript abundance; White bar: Non-parasitized larvae; Grey bar: Parasitized larvae; Black bar: CvBV-injected larvae. Letters on the top of bars indicate the significantly different means within the relative transcript abundances at specific time points under different treatment by one-way analysis of variance (ANOVA) analysis (n = 3, P < 0.05).

