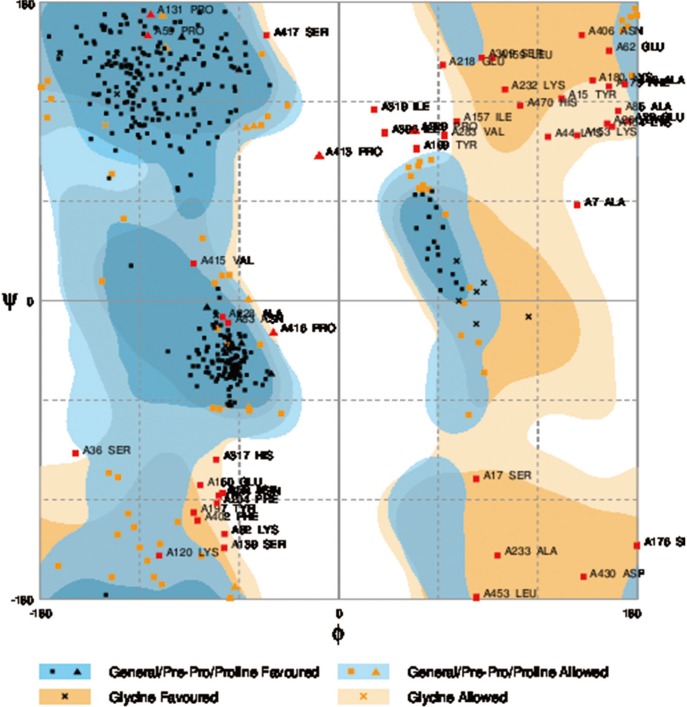
Fig. 6.
Validation of protein structure using Ramachandran plot. The Ramachandran plot shows that 75.3% of amino acid residues from modeled structure were incorporated in the favored regions of the plot. Fourteen point six percentages of the residues were in allowed regions of the plot and 10.1% of residue in outlier region.

