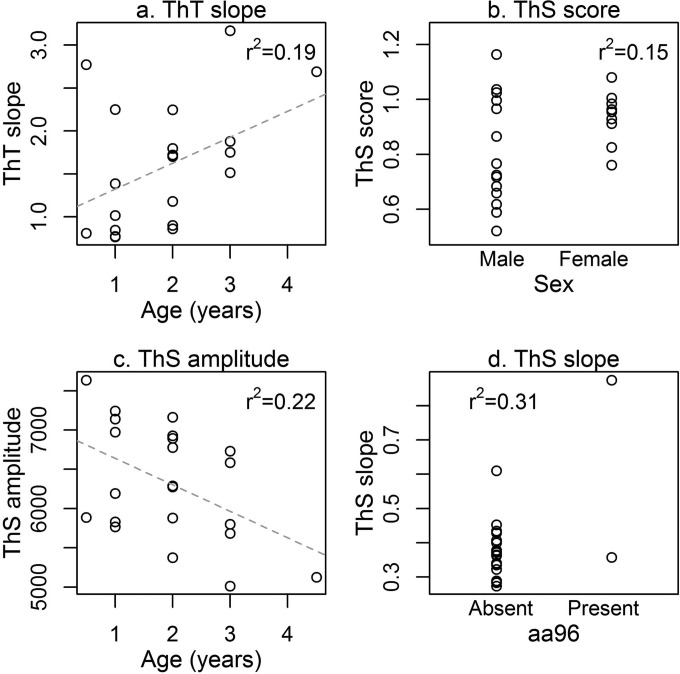
FIG 4.
Distribution of QuIC metric data associated with the best predictor variable in each case (see Fig. 3). Coefficients of variation are given in each panel. These results show a positive correlation between ThS slope and cervid PrP amino acid 96 identity (for full model comparison table, see Table S1 in the supplemental material). The dashed line represents the trend line determined from the data.

